Please scroll down
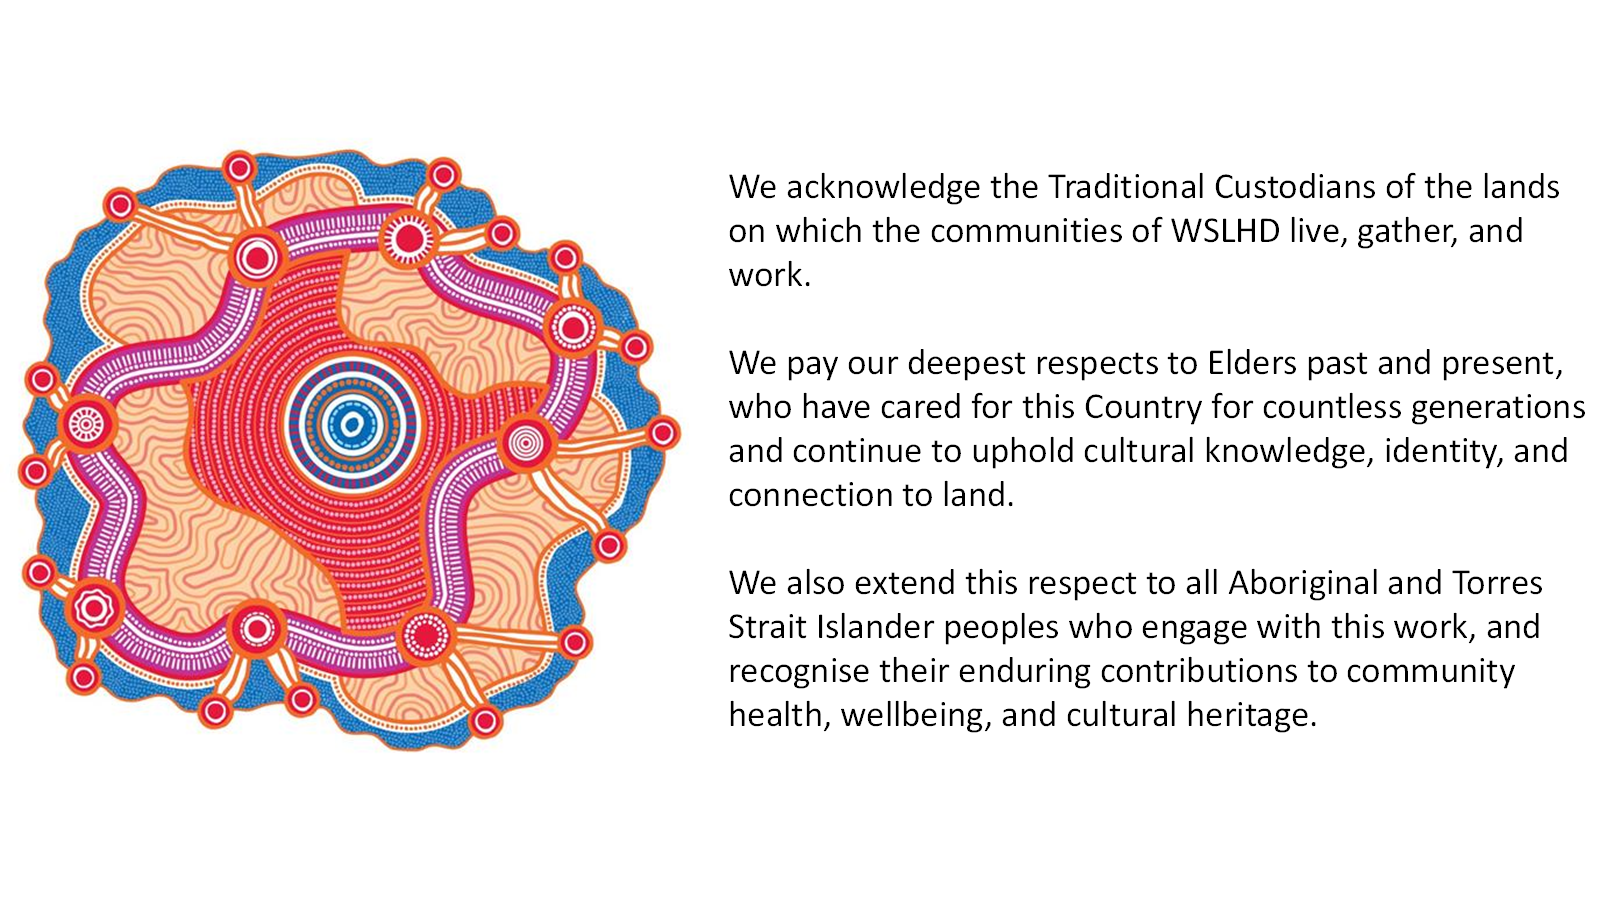
Image Source: WSLHD Media
At the heart of the artwork is Western Sydney Local Health District (WSLHD), surrounded by eight values shown in mauve. The red elements represent the local Aboriginal community, strengthened by these values.
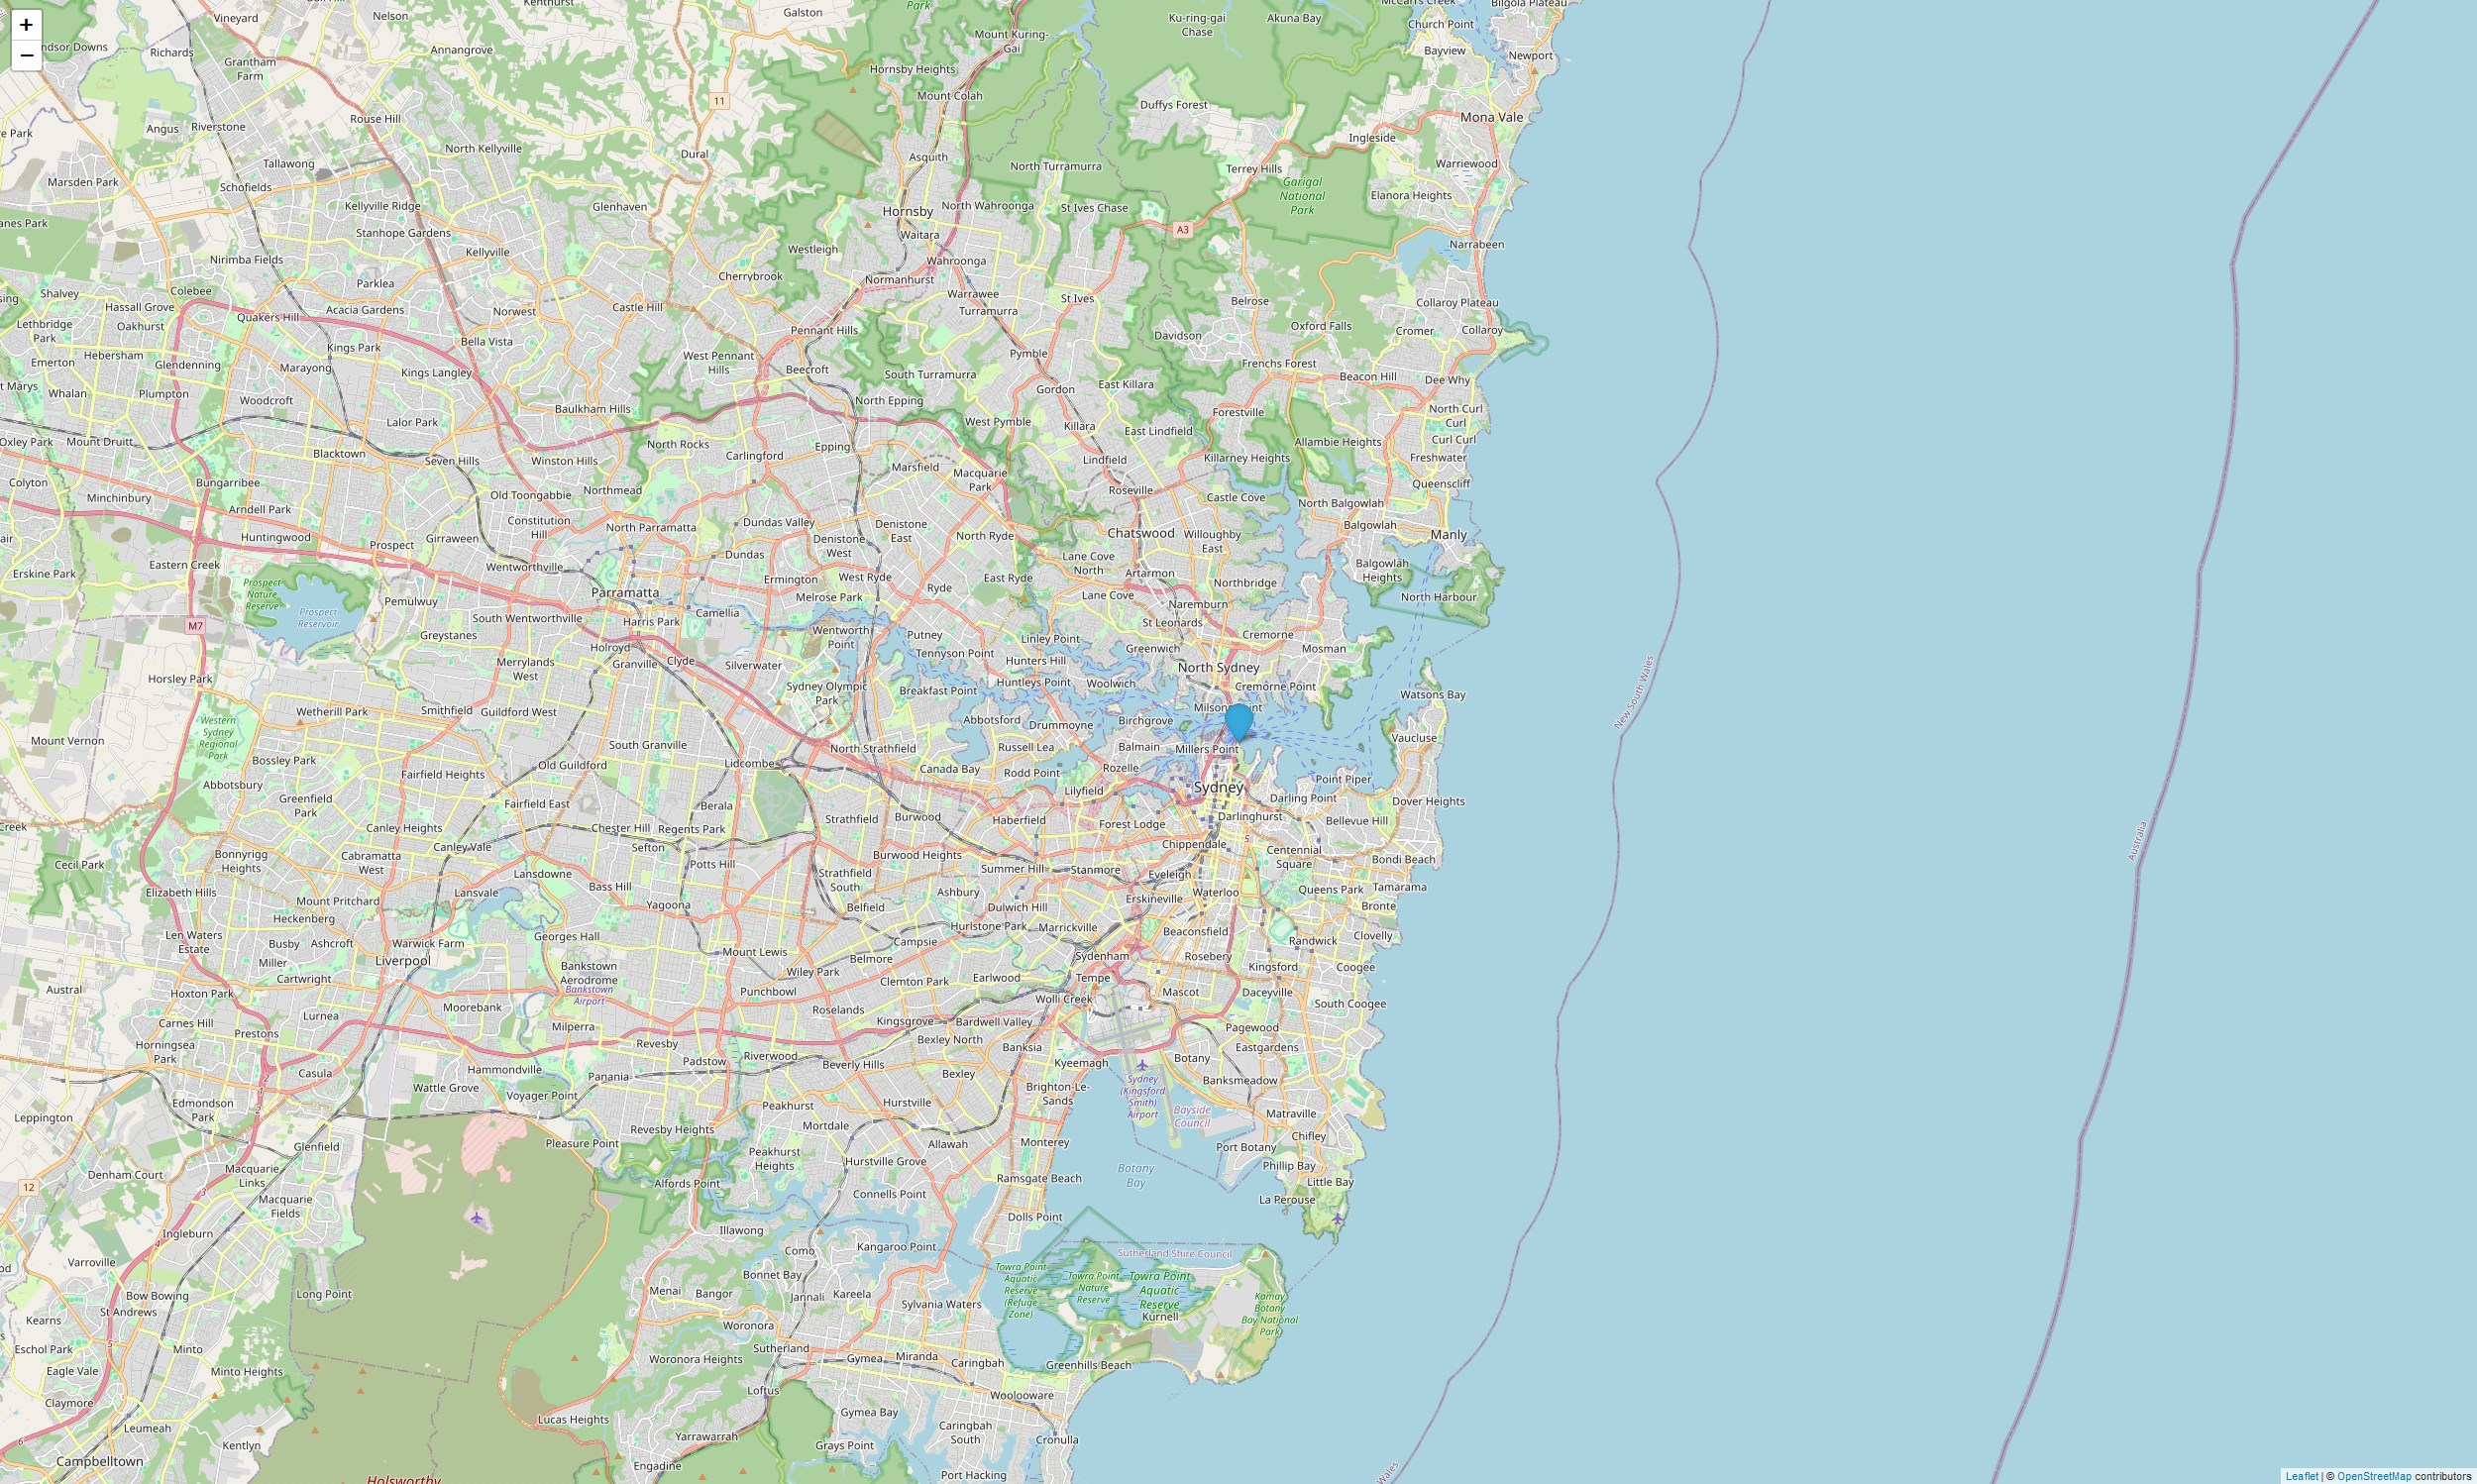
Welcome to Sydney, Australia!
This is a city map.
The blue marker represents the iconic Sydney Opera House, an enduring symbol of Sydney that attracts visitors from all over the world.
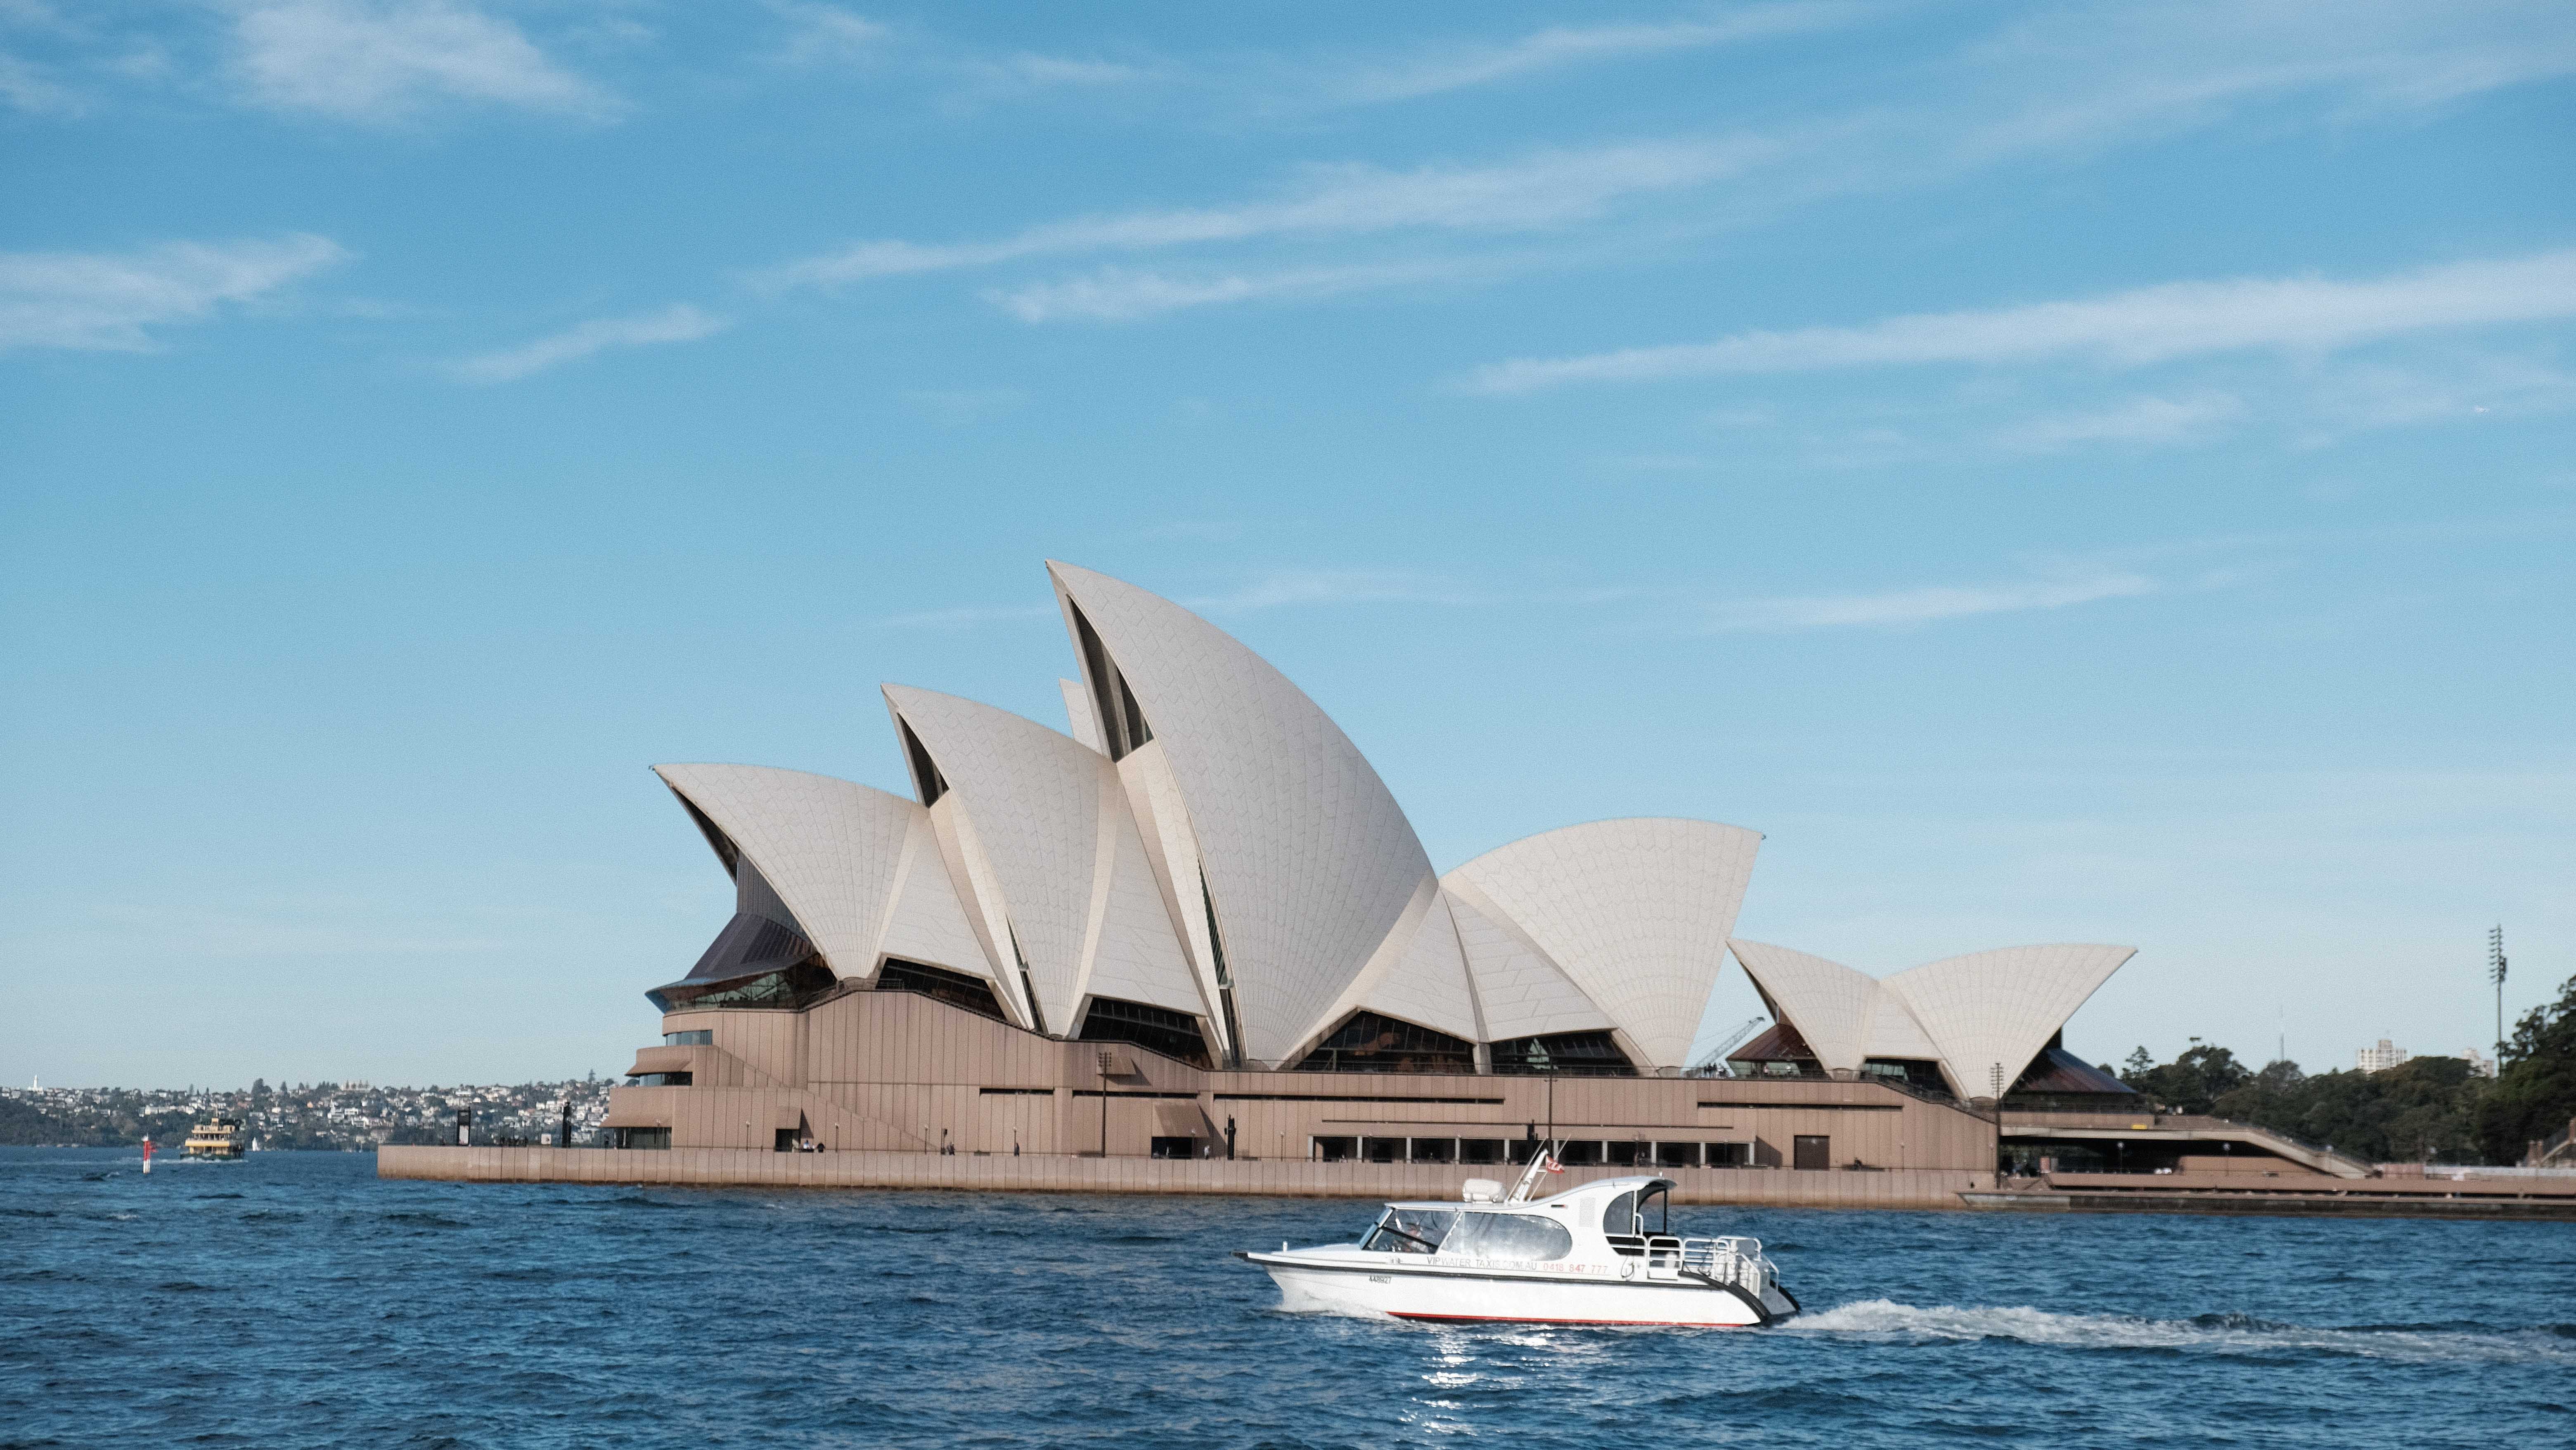 Image Source: Photograph by Zachary Xie
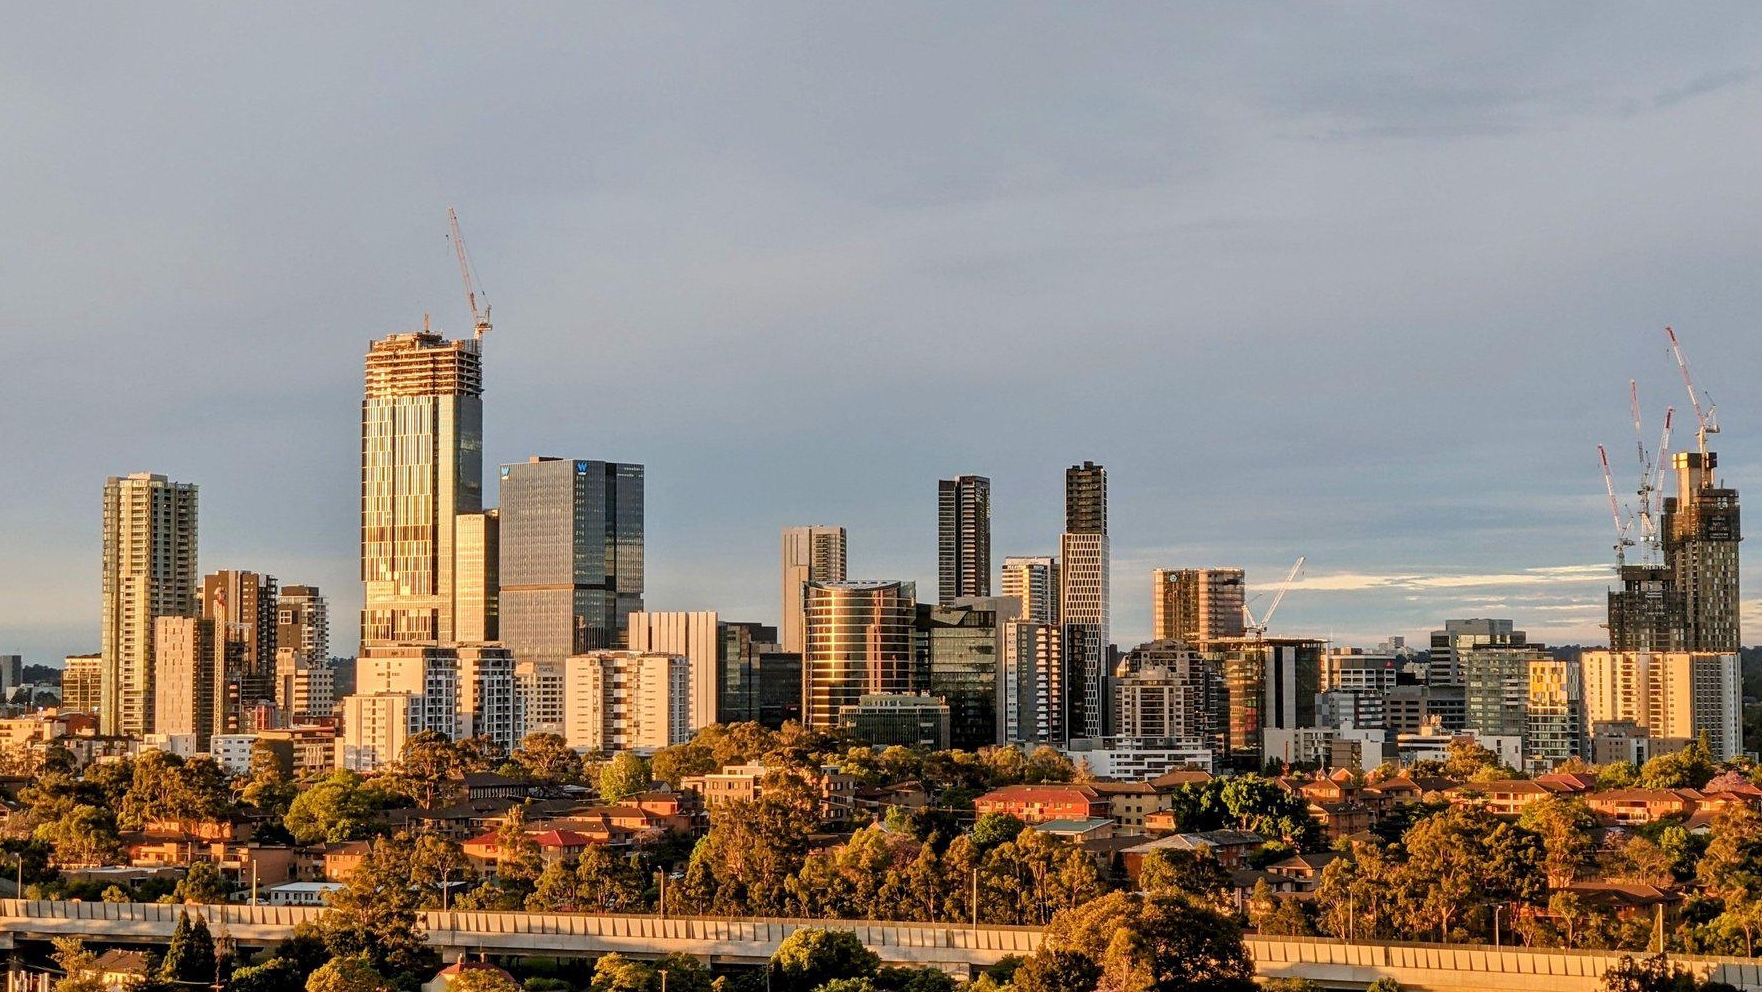
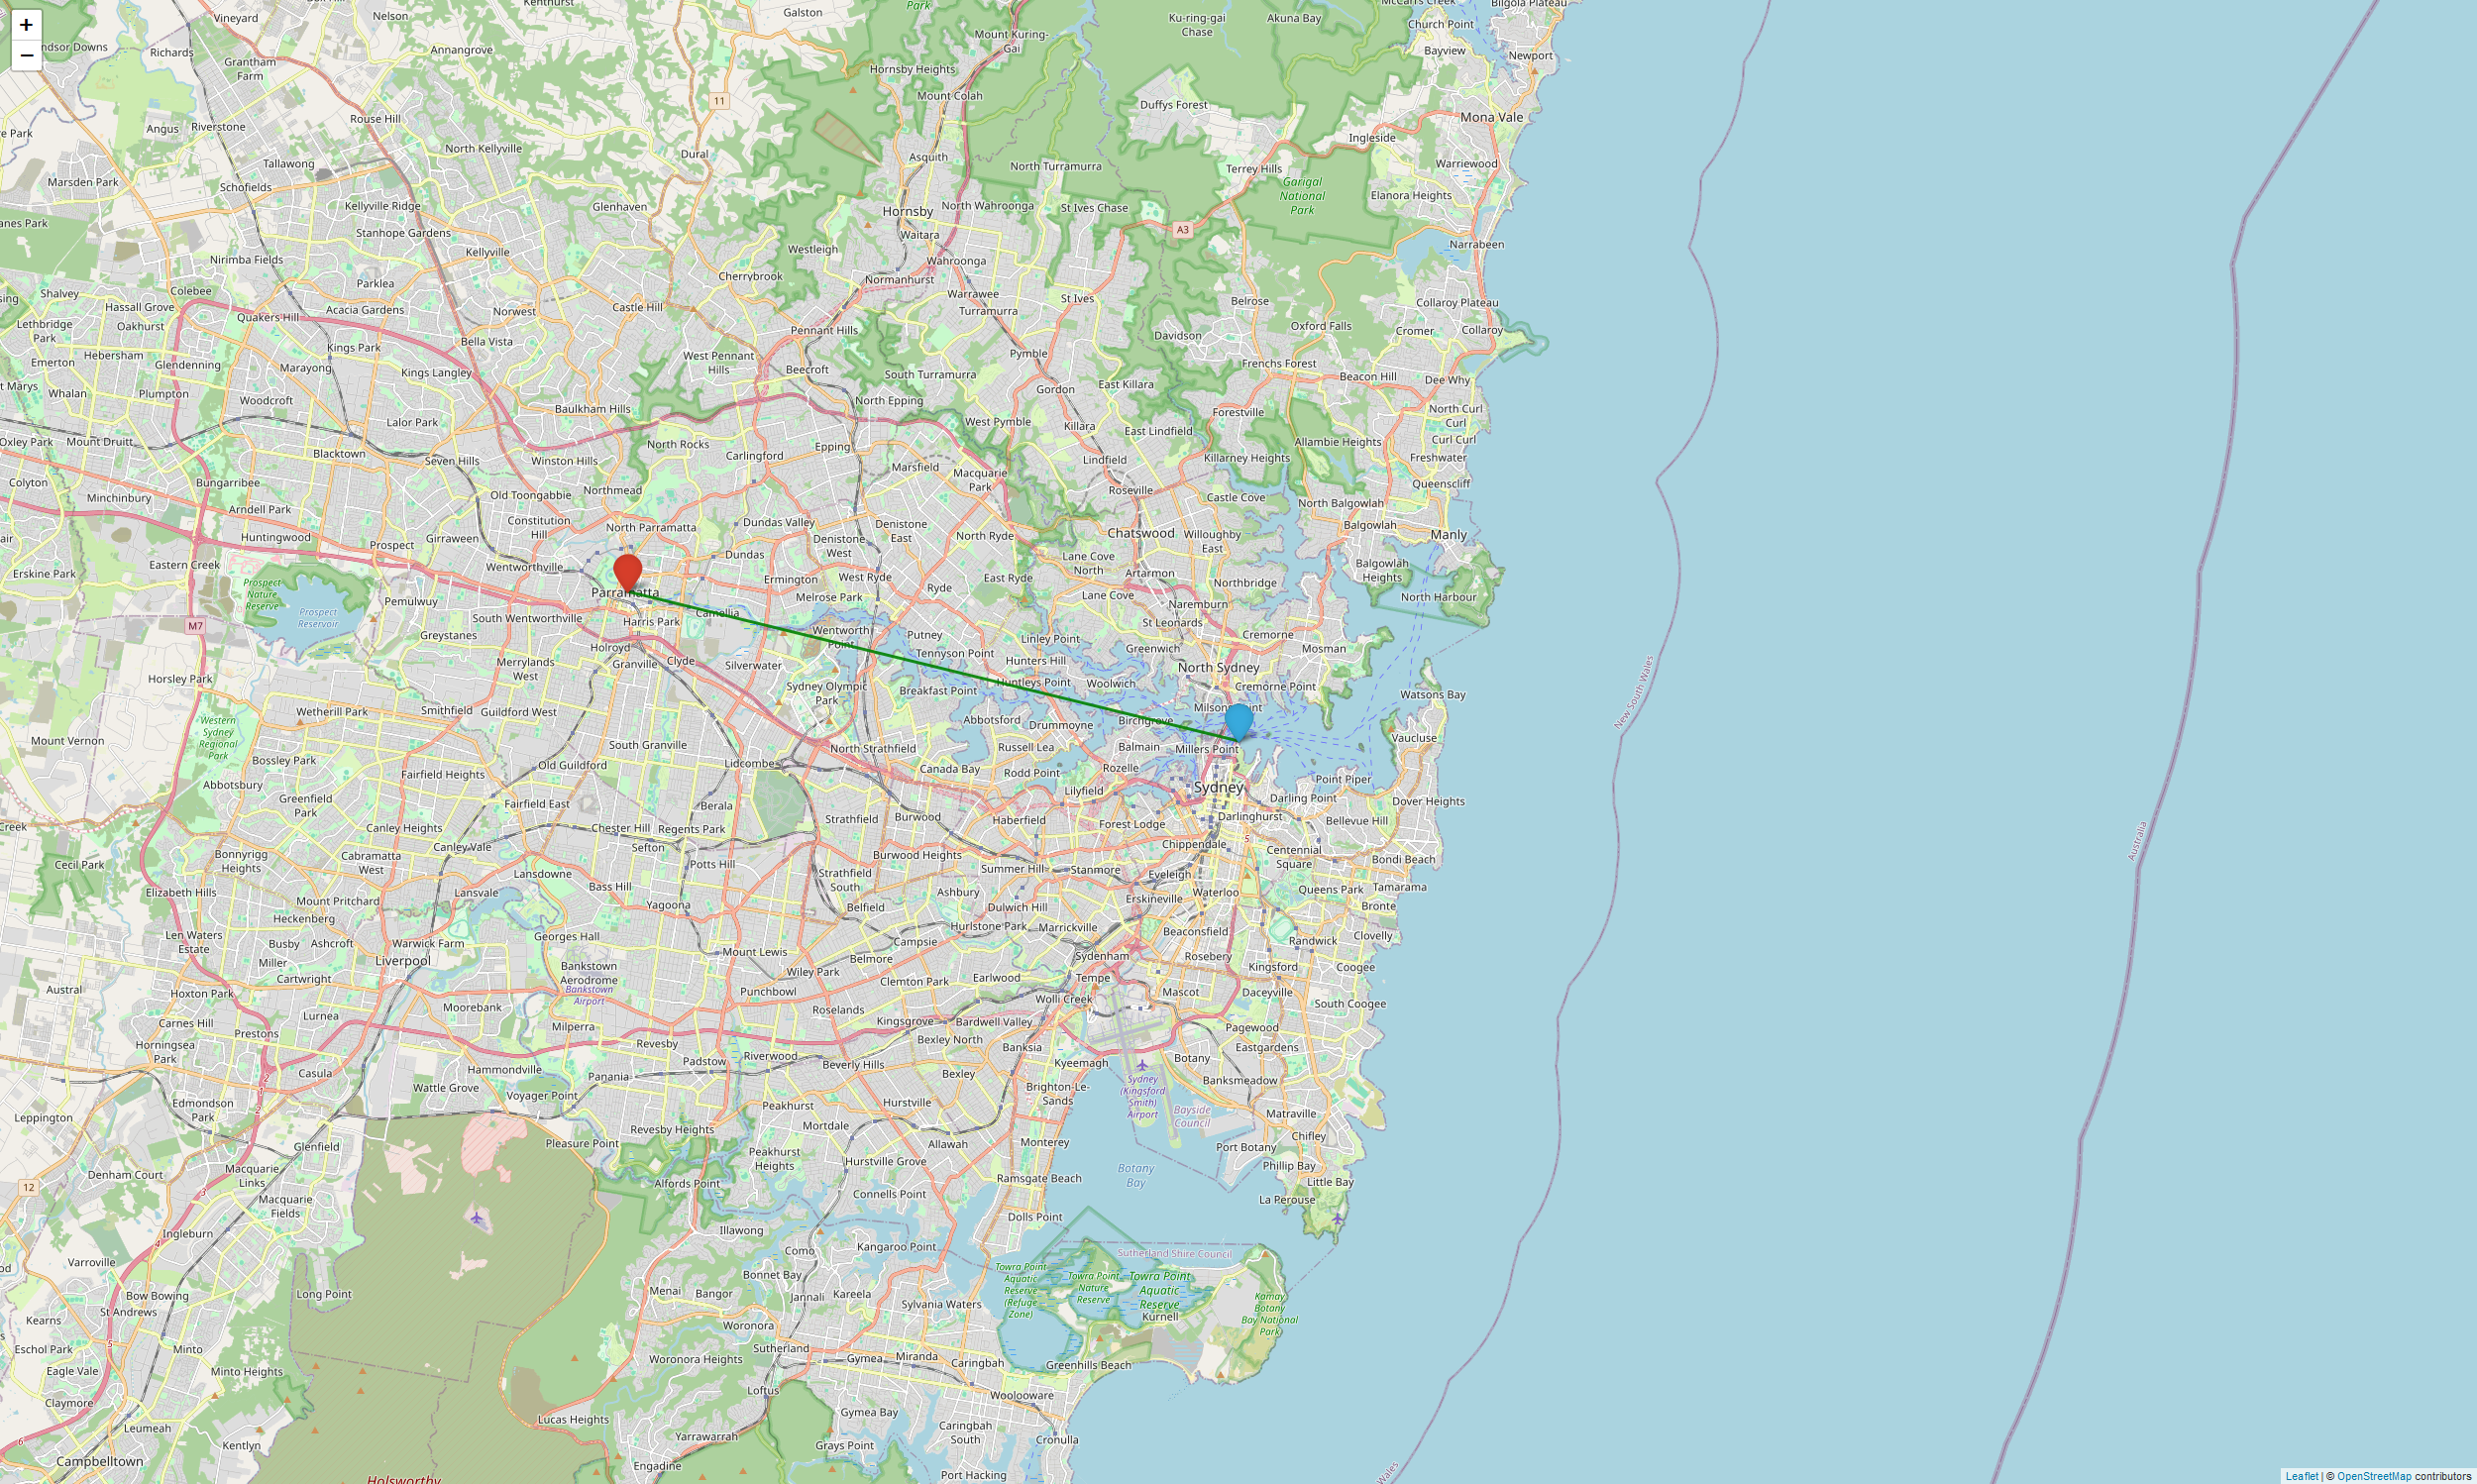
From the Sydney Opera House, about 30 kilometres to the west, lies Western Sydney.
Western Sydney is a rapidly developing region.
The red marker represents Parramatta CBD, which is the vibrant heart of Western Sydney.
Just nearby lies Sydney Olympic Park, home to the city’s largest stadium and the main venue of the 2000 Summer Olympics.
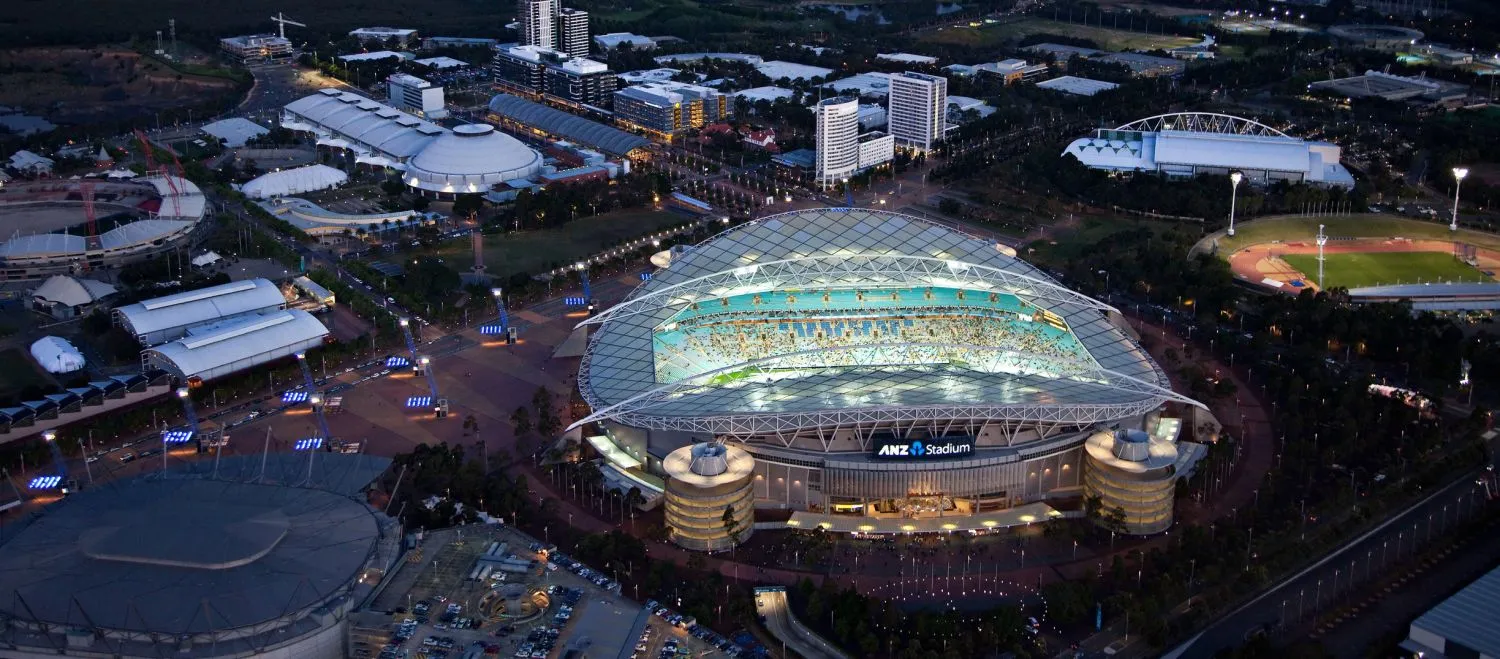 Image Source: Sydney.com
In this document, I will use 2021 and 2011 Census data from the Australian Bureau of Statistics (ABS) to tell you a story about the demographic, socioeconomic, and health profiles of Western Sydney and its people.
Let’s begin with a brief introduction to Western Sydney.
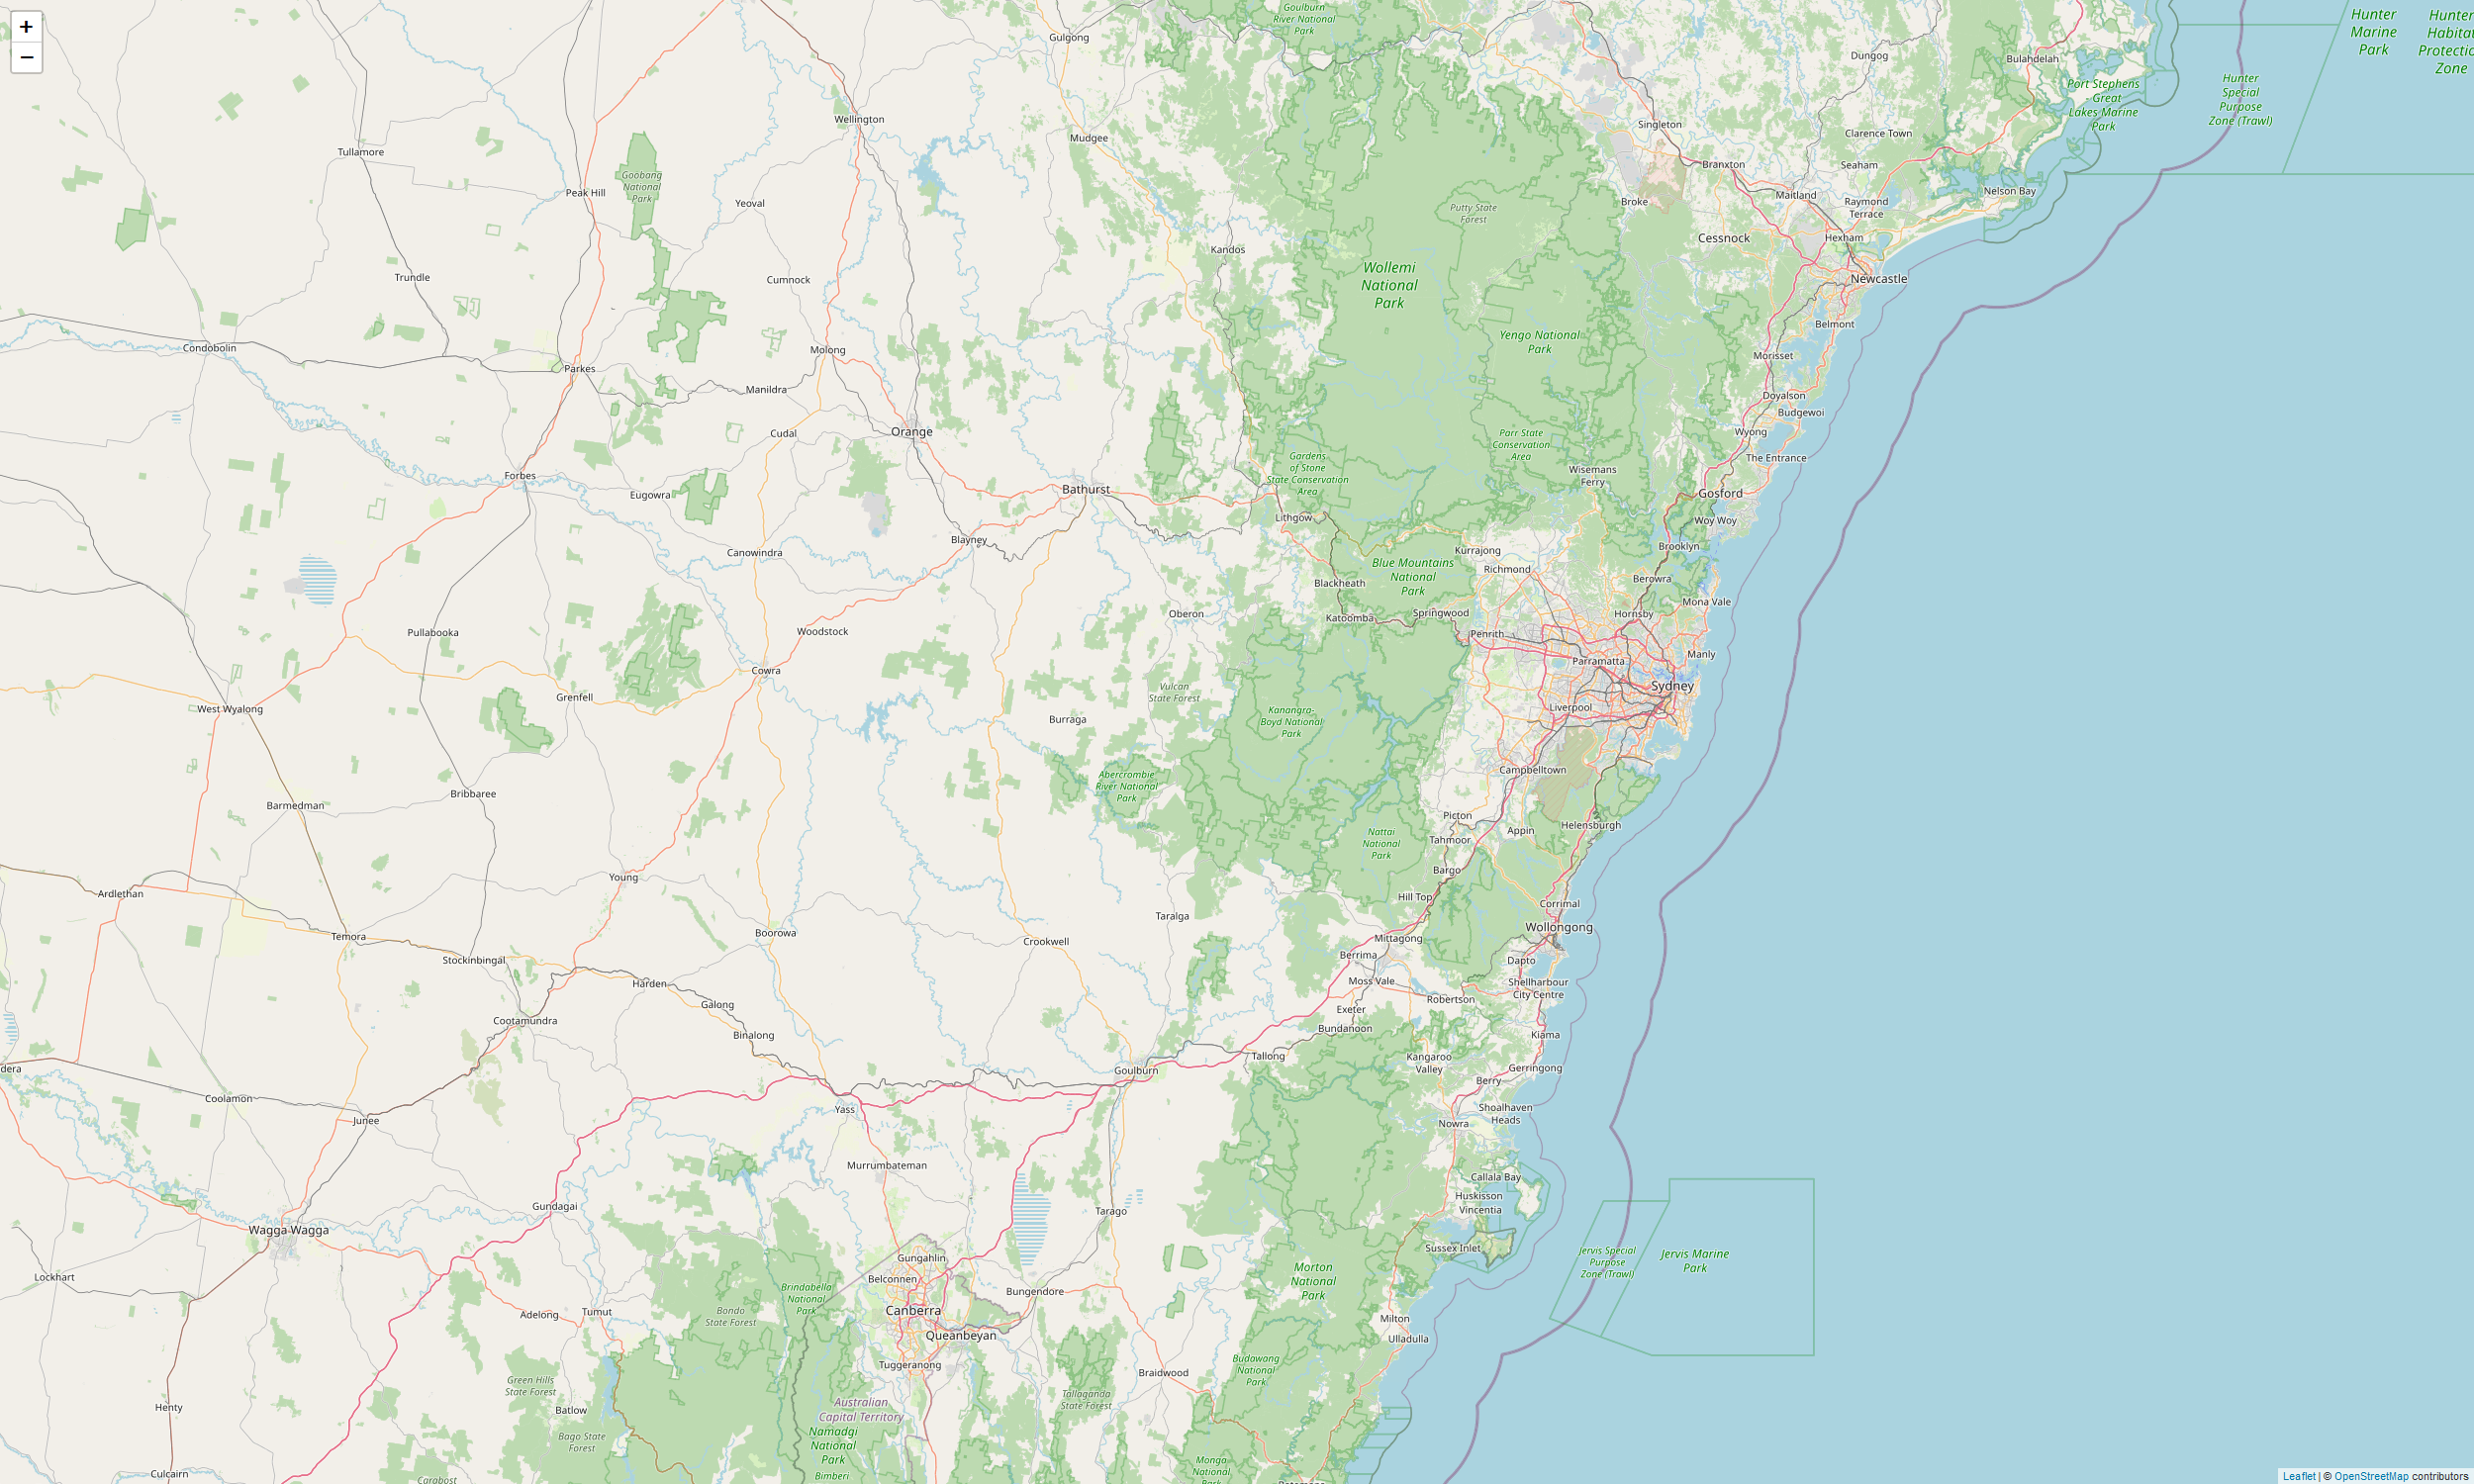
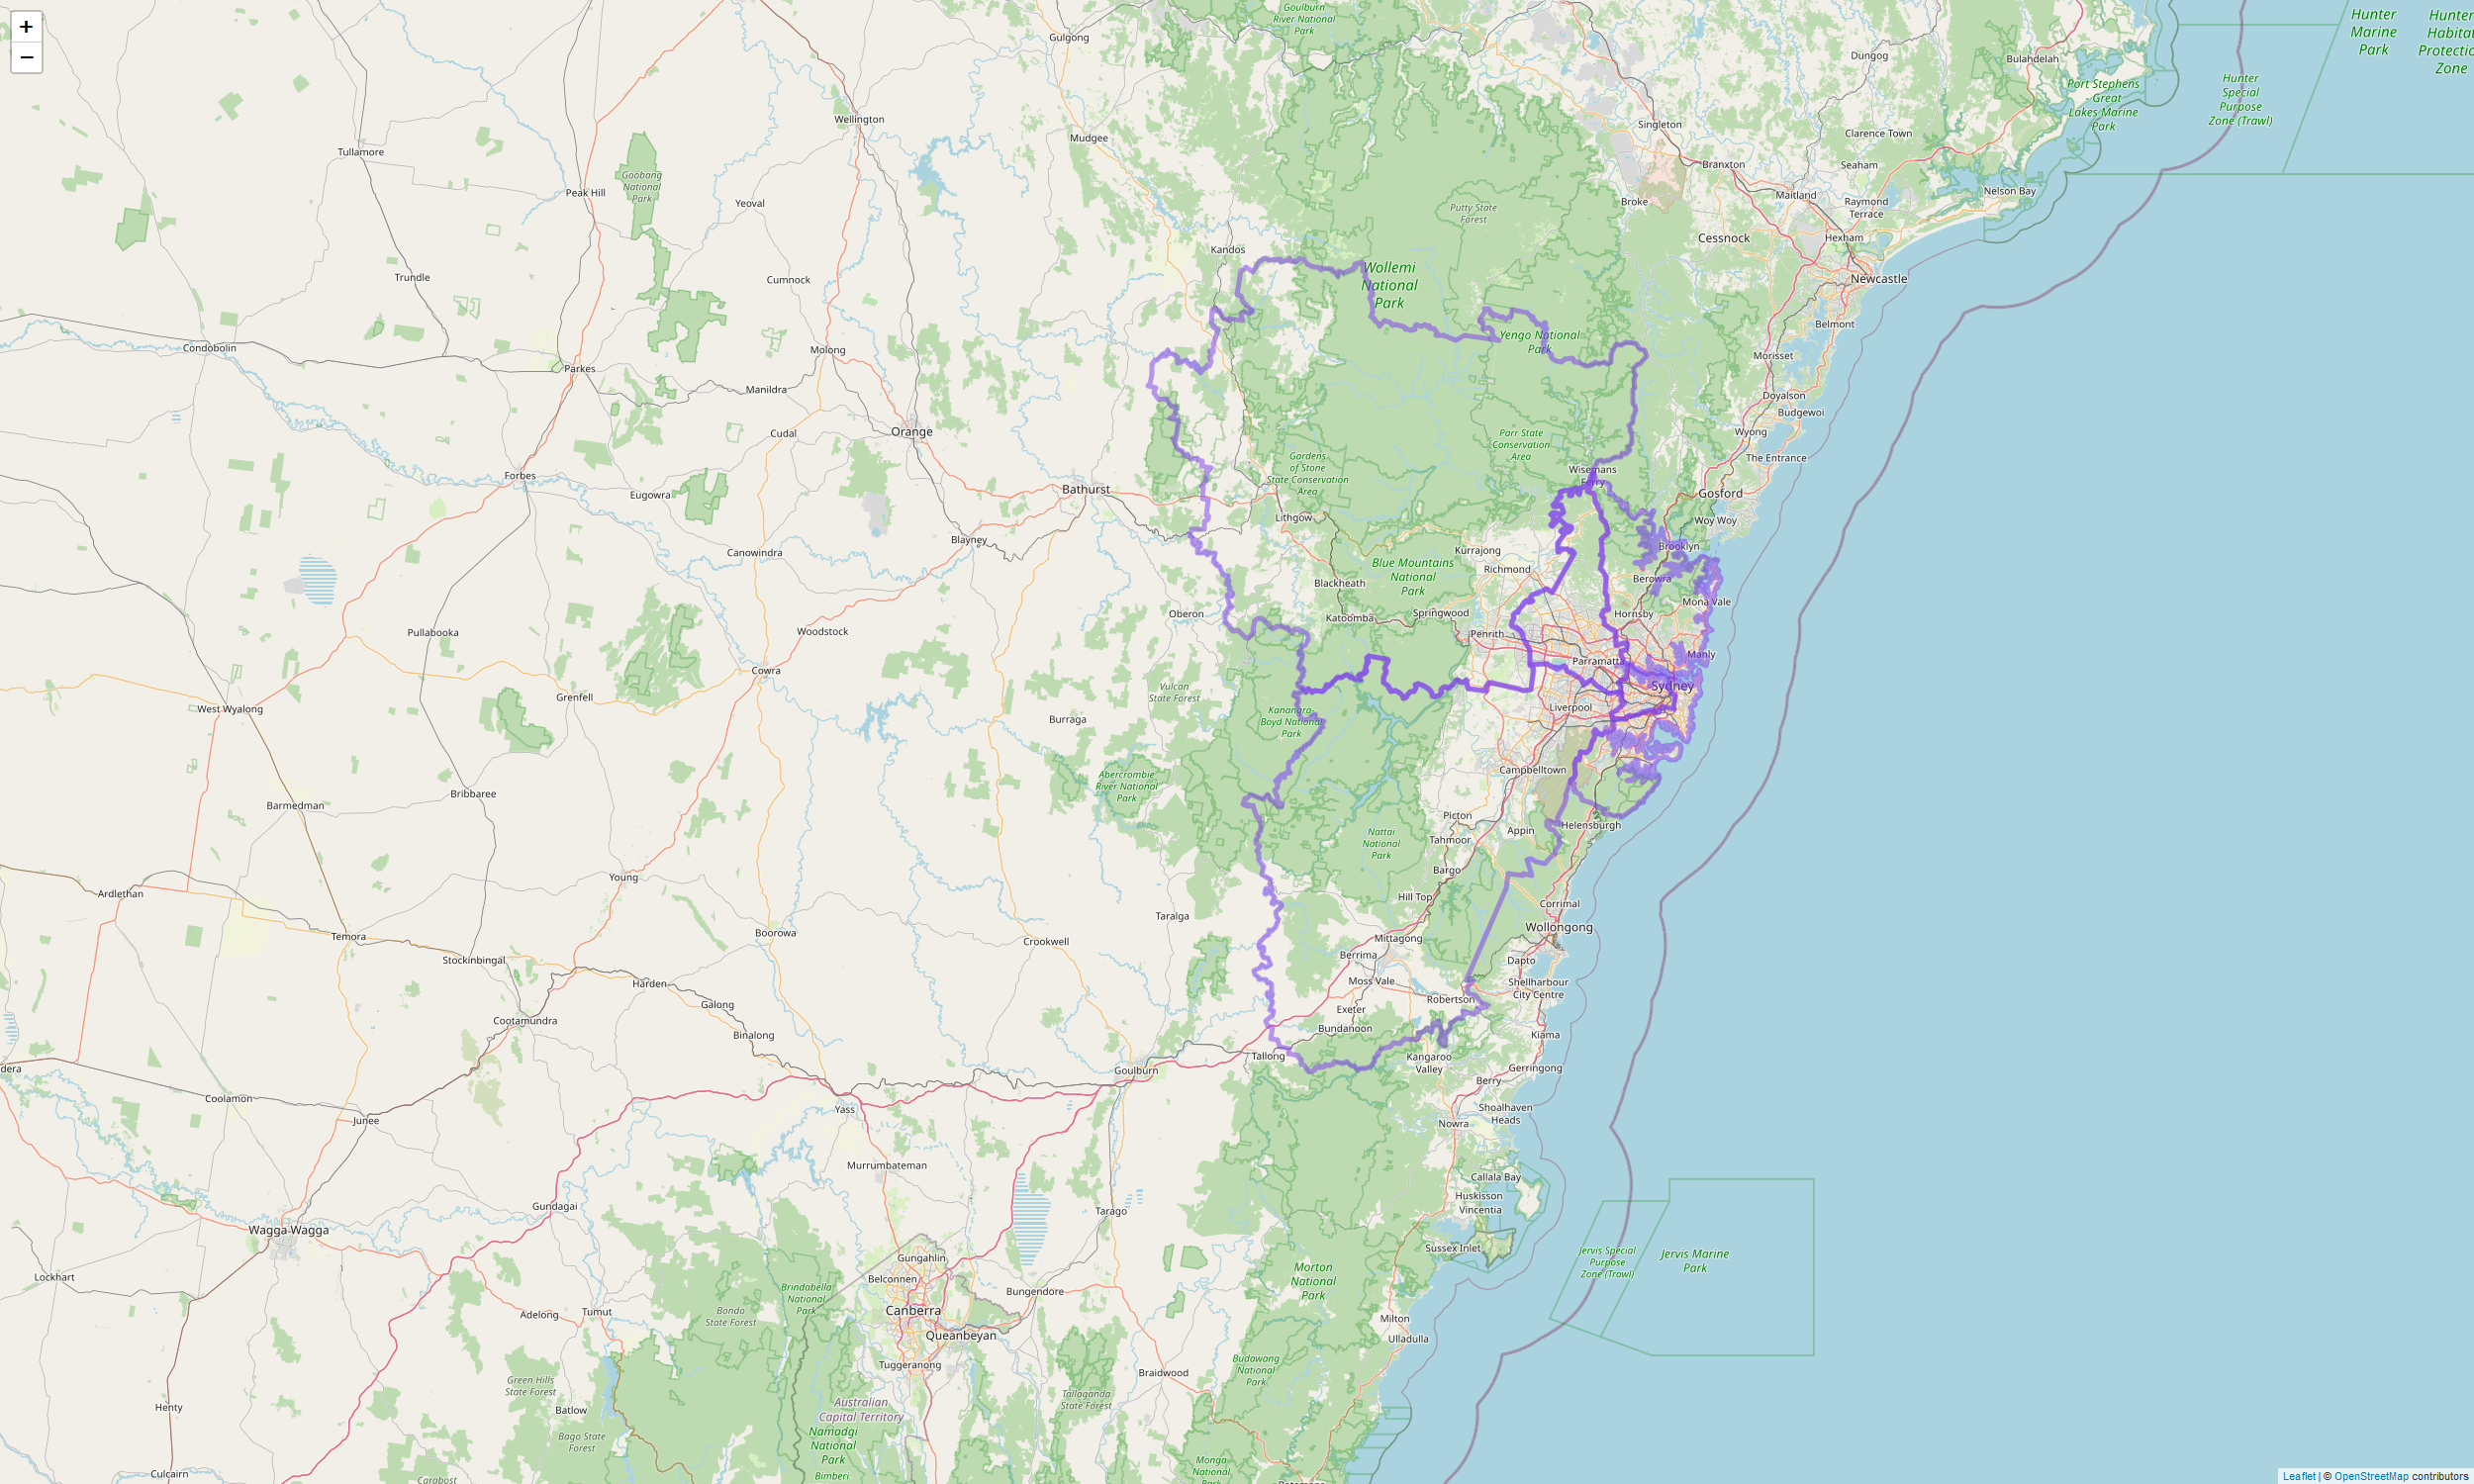
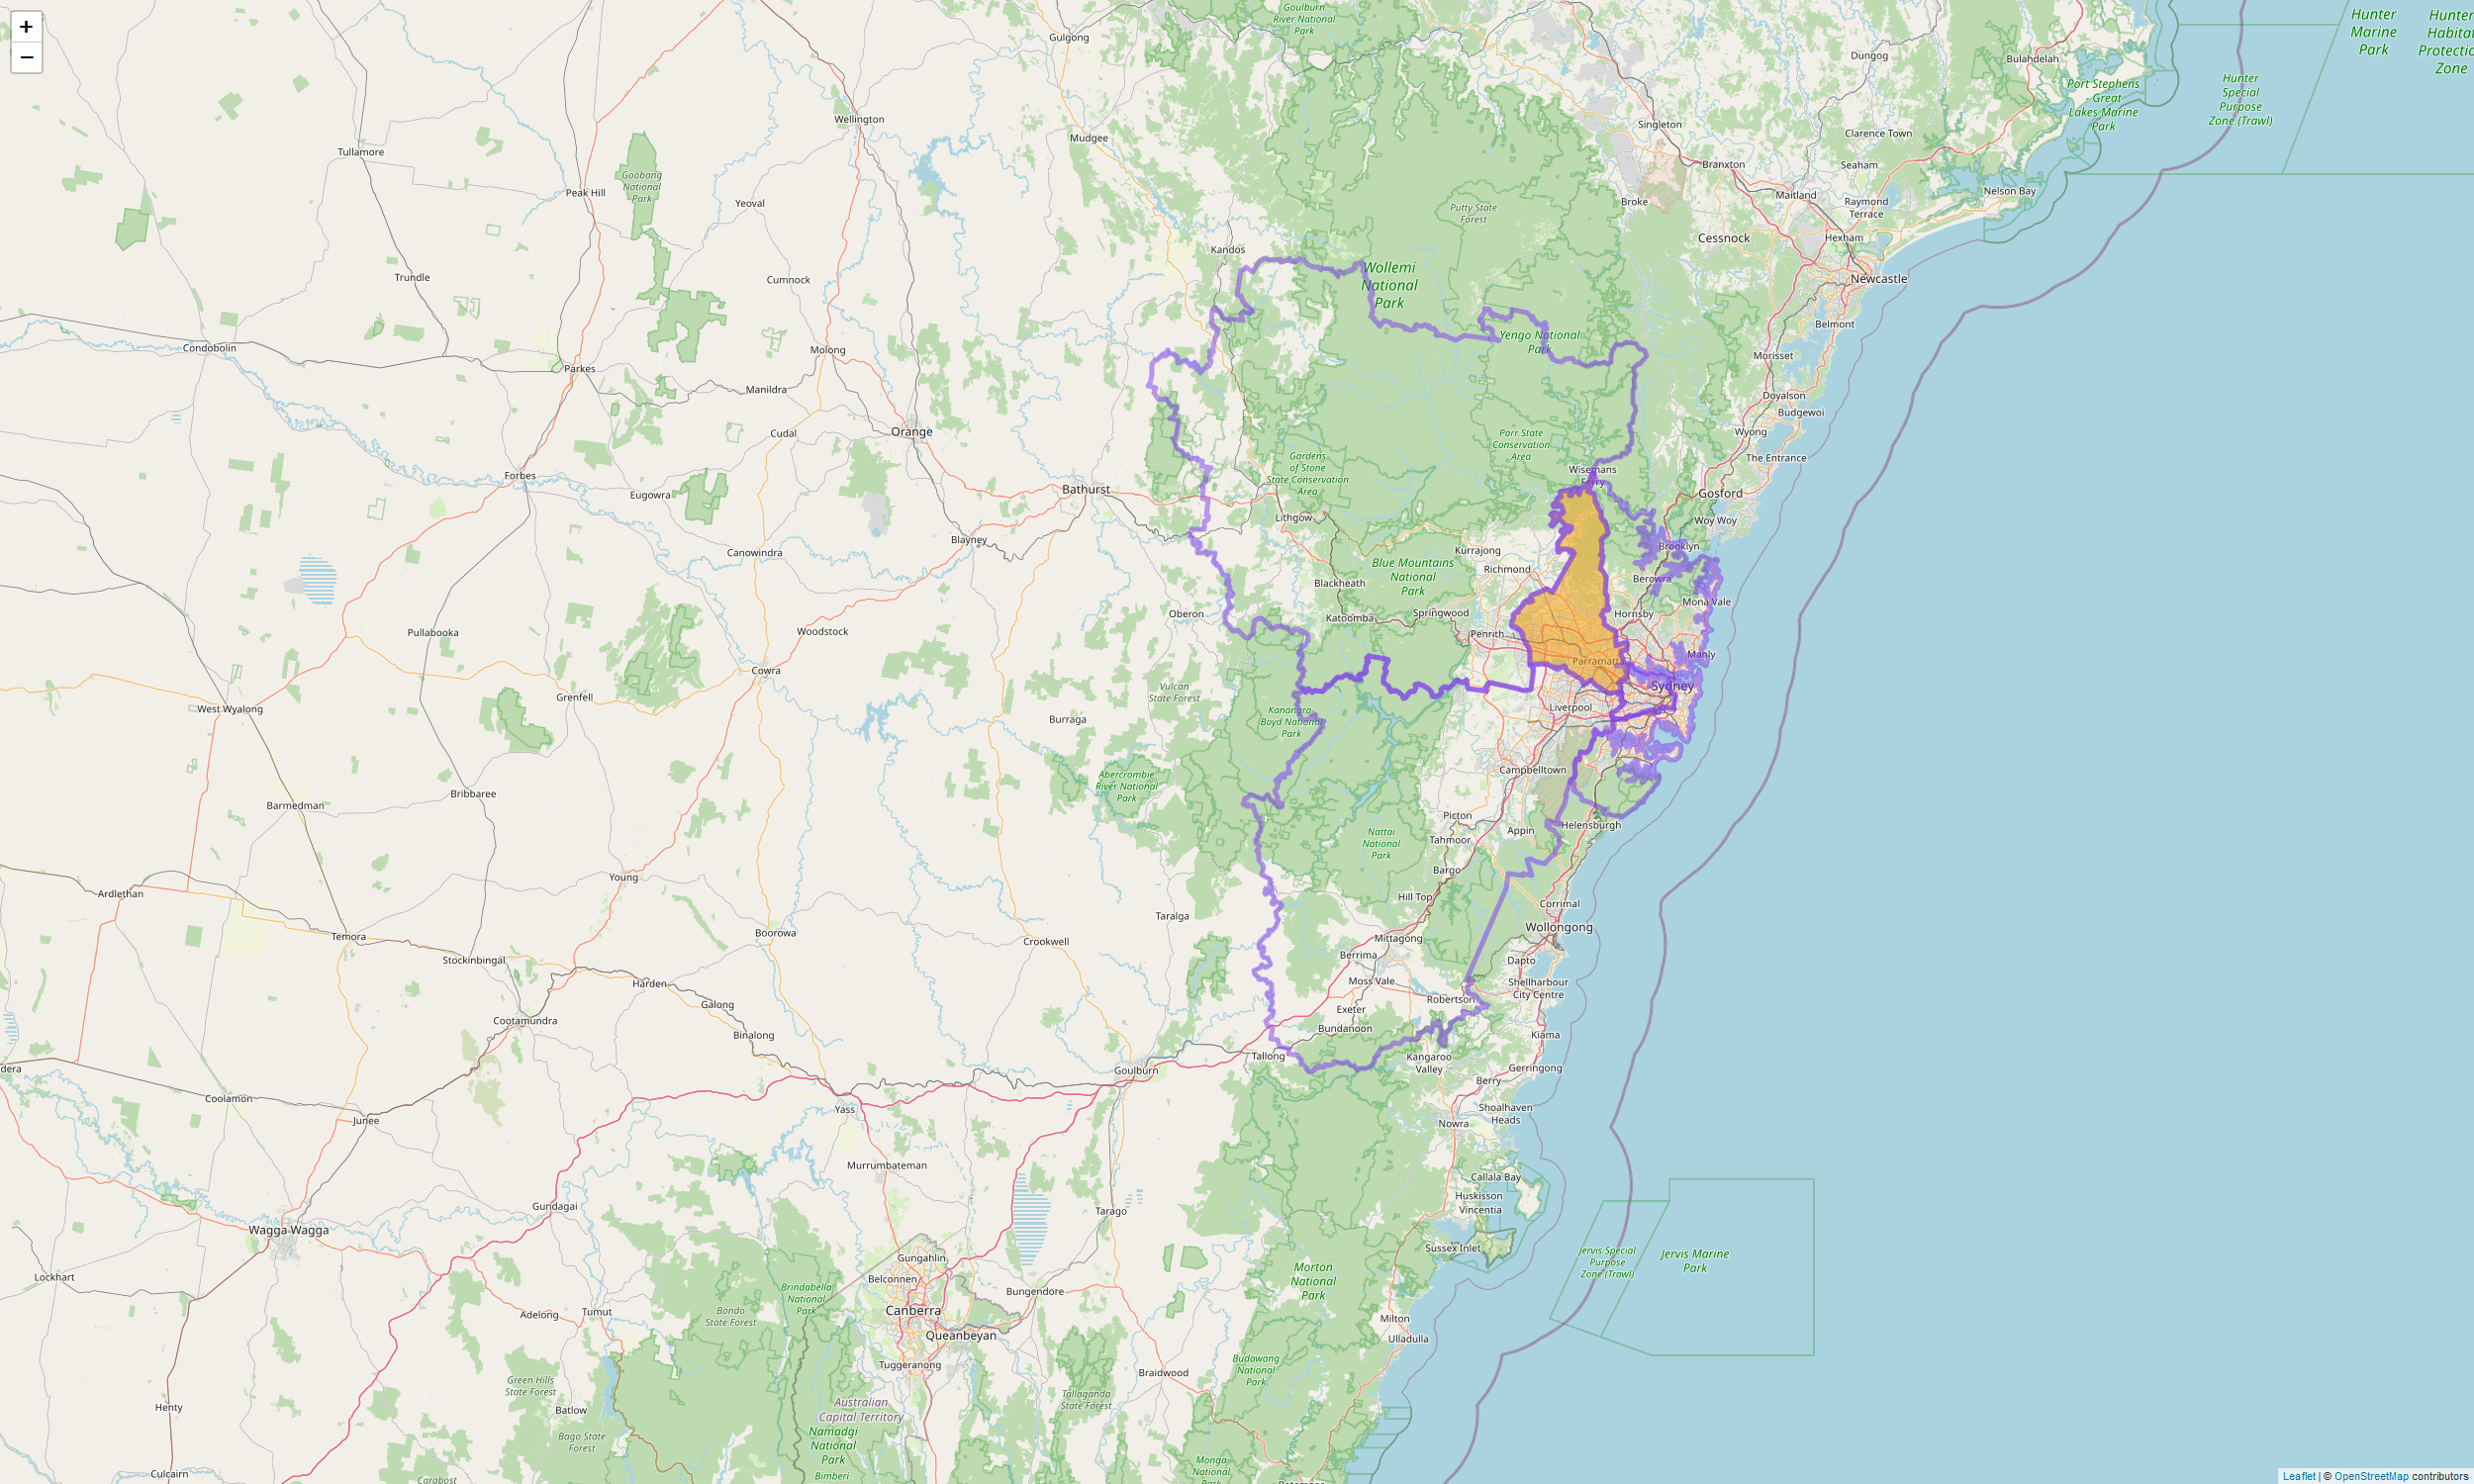
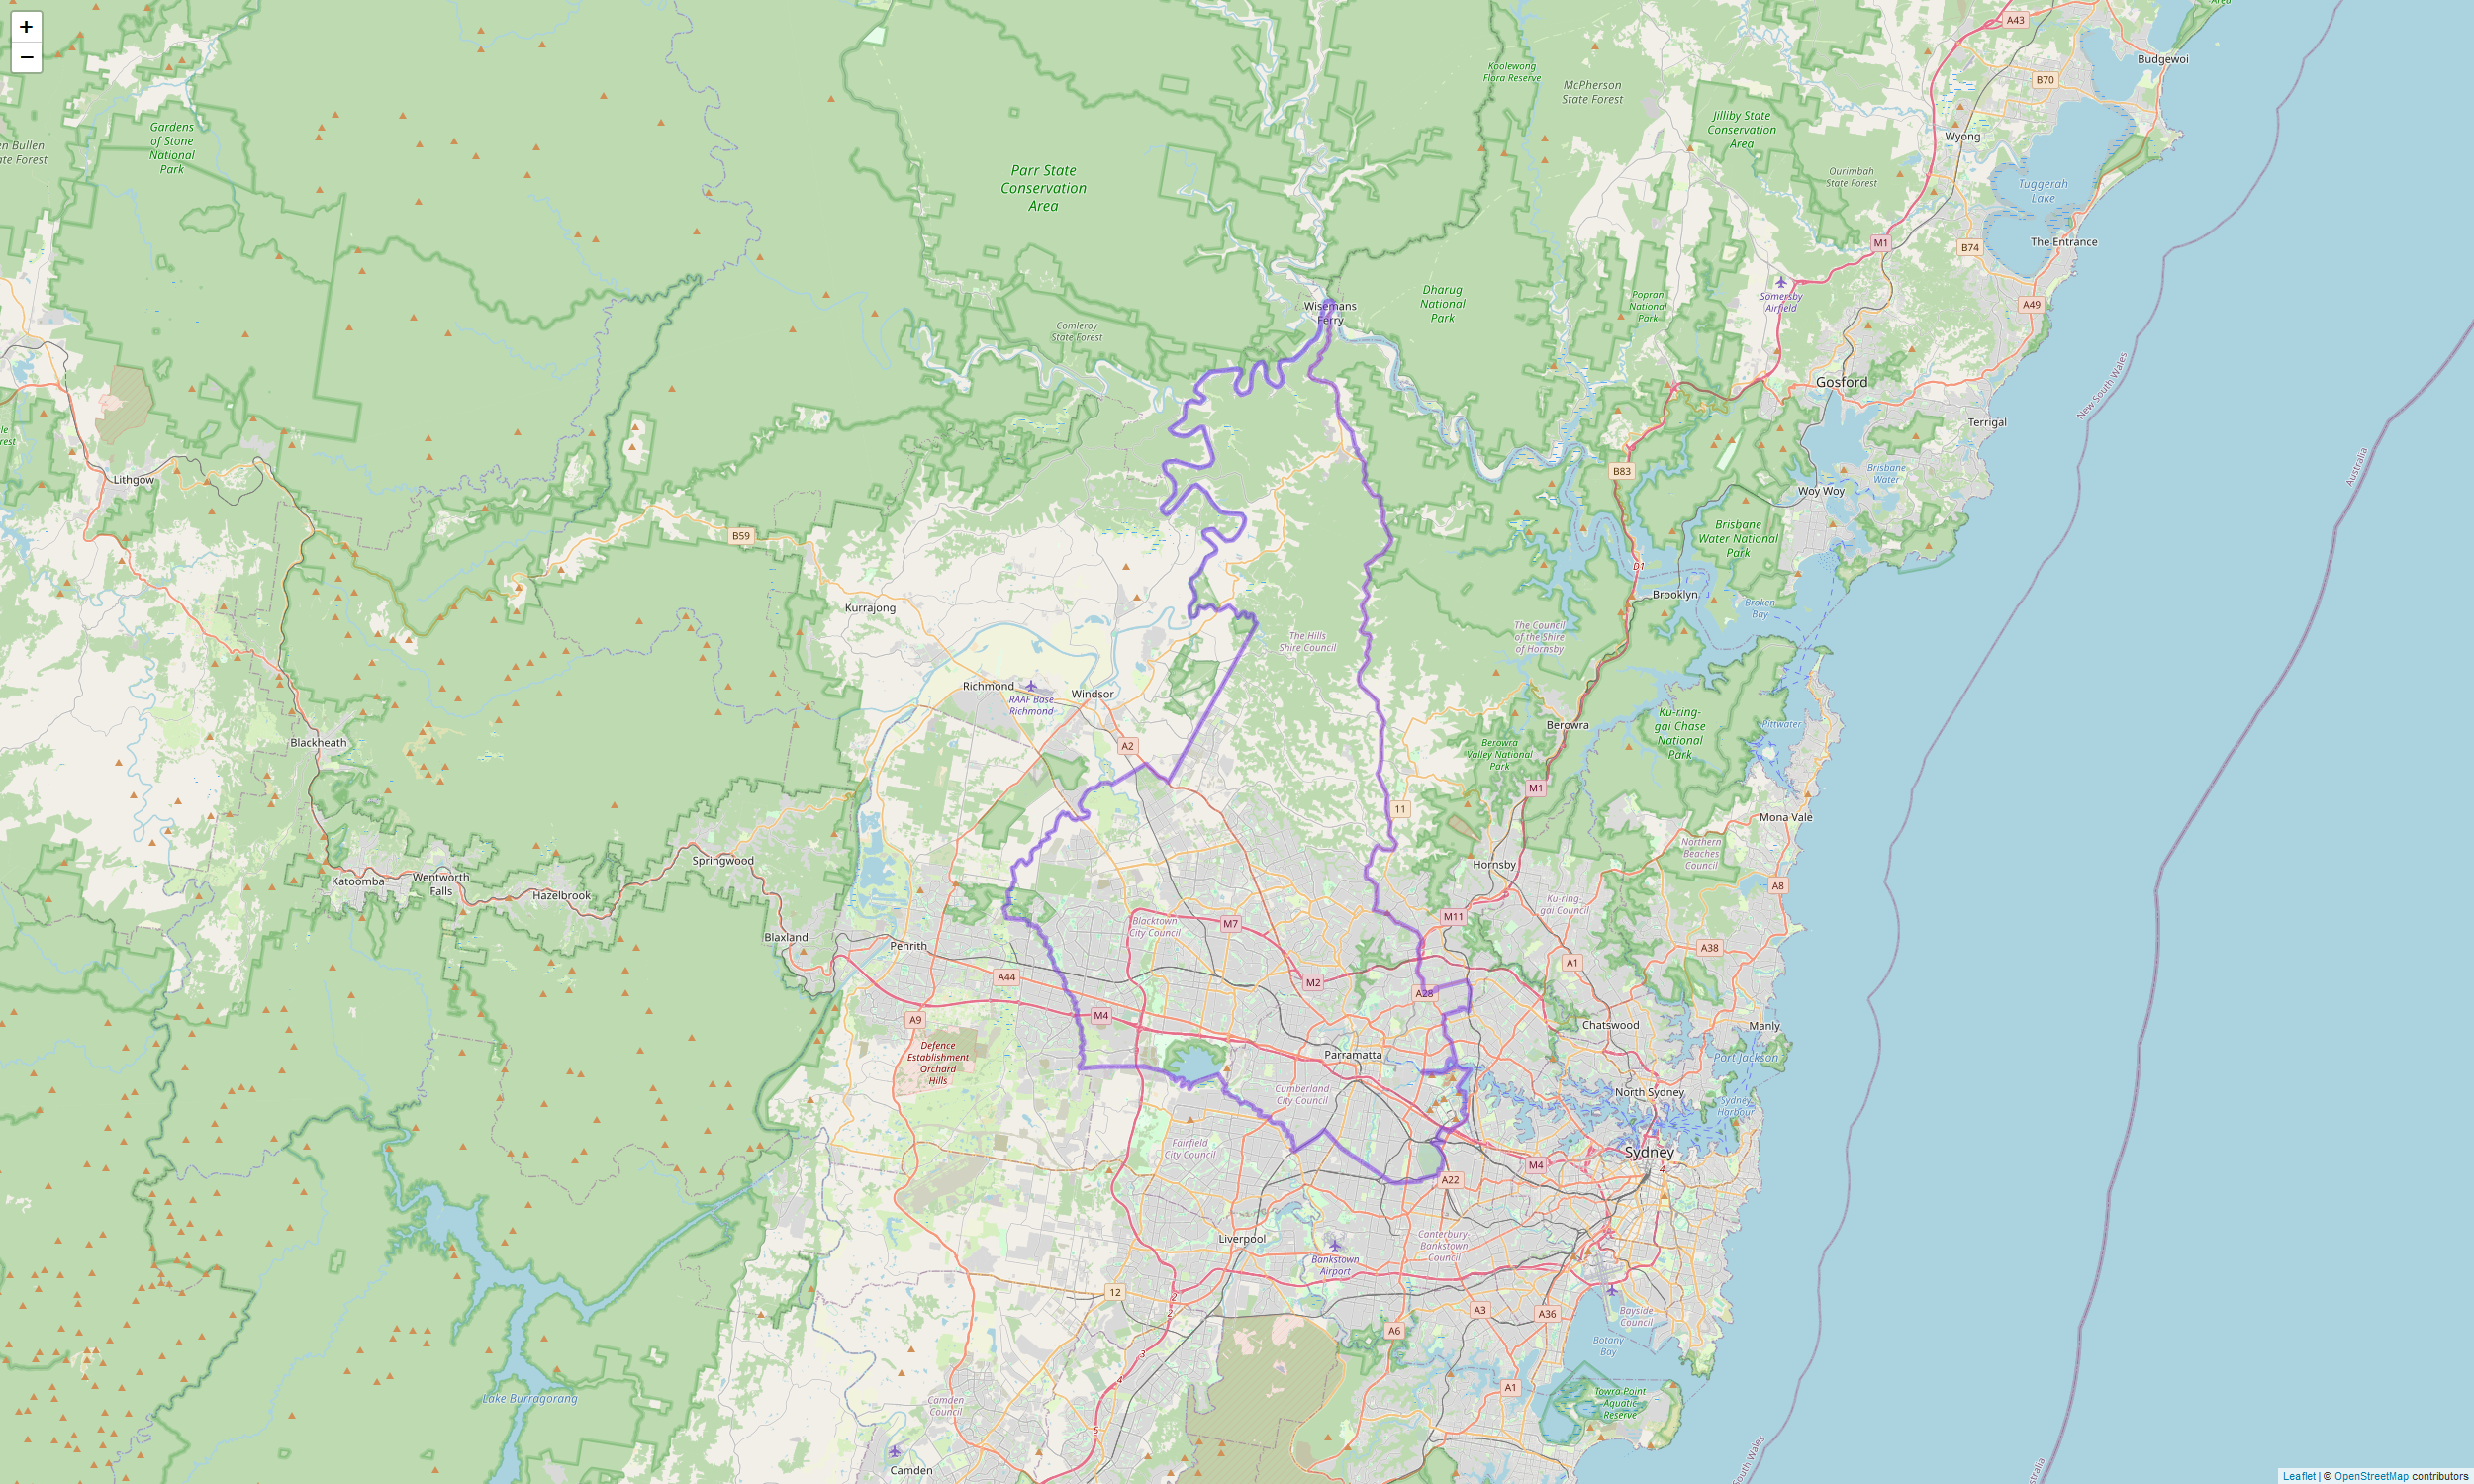
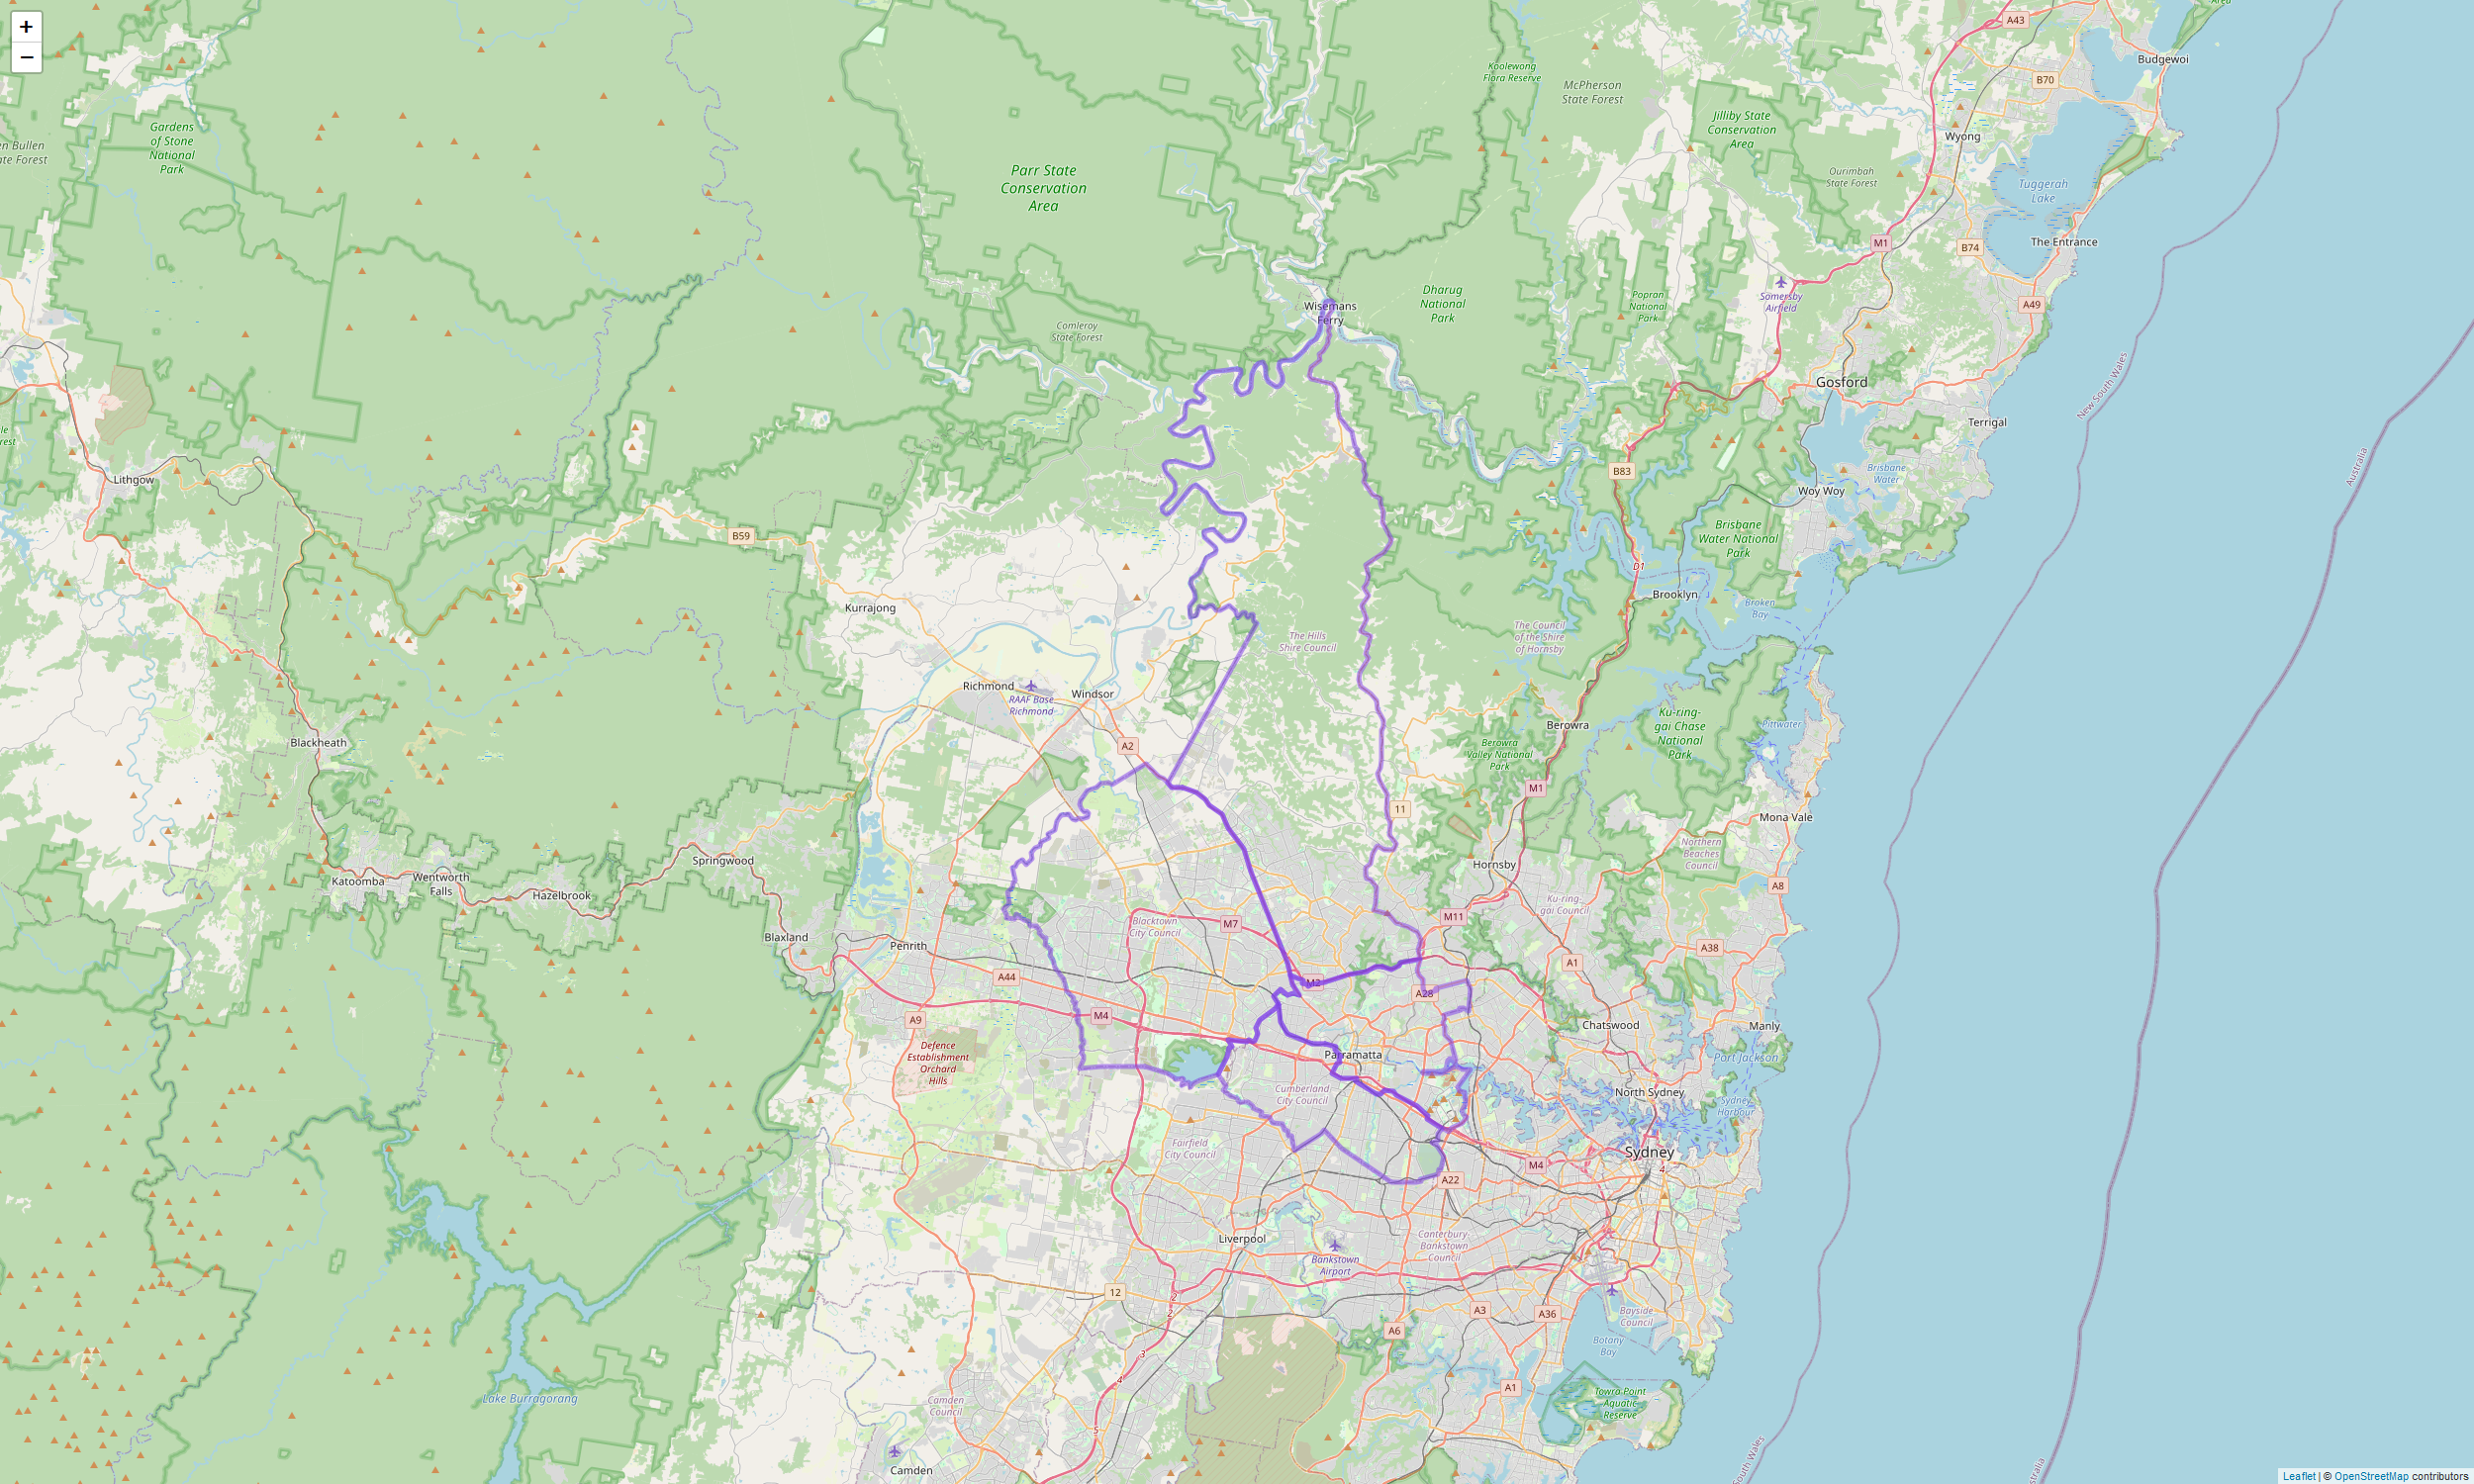
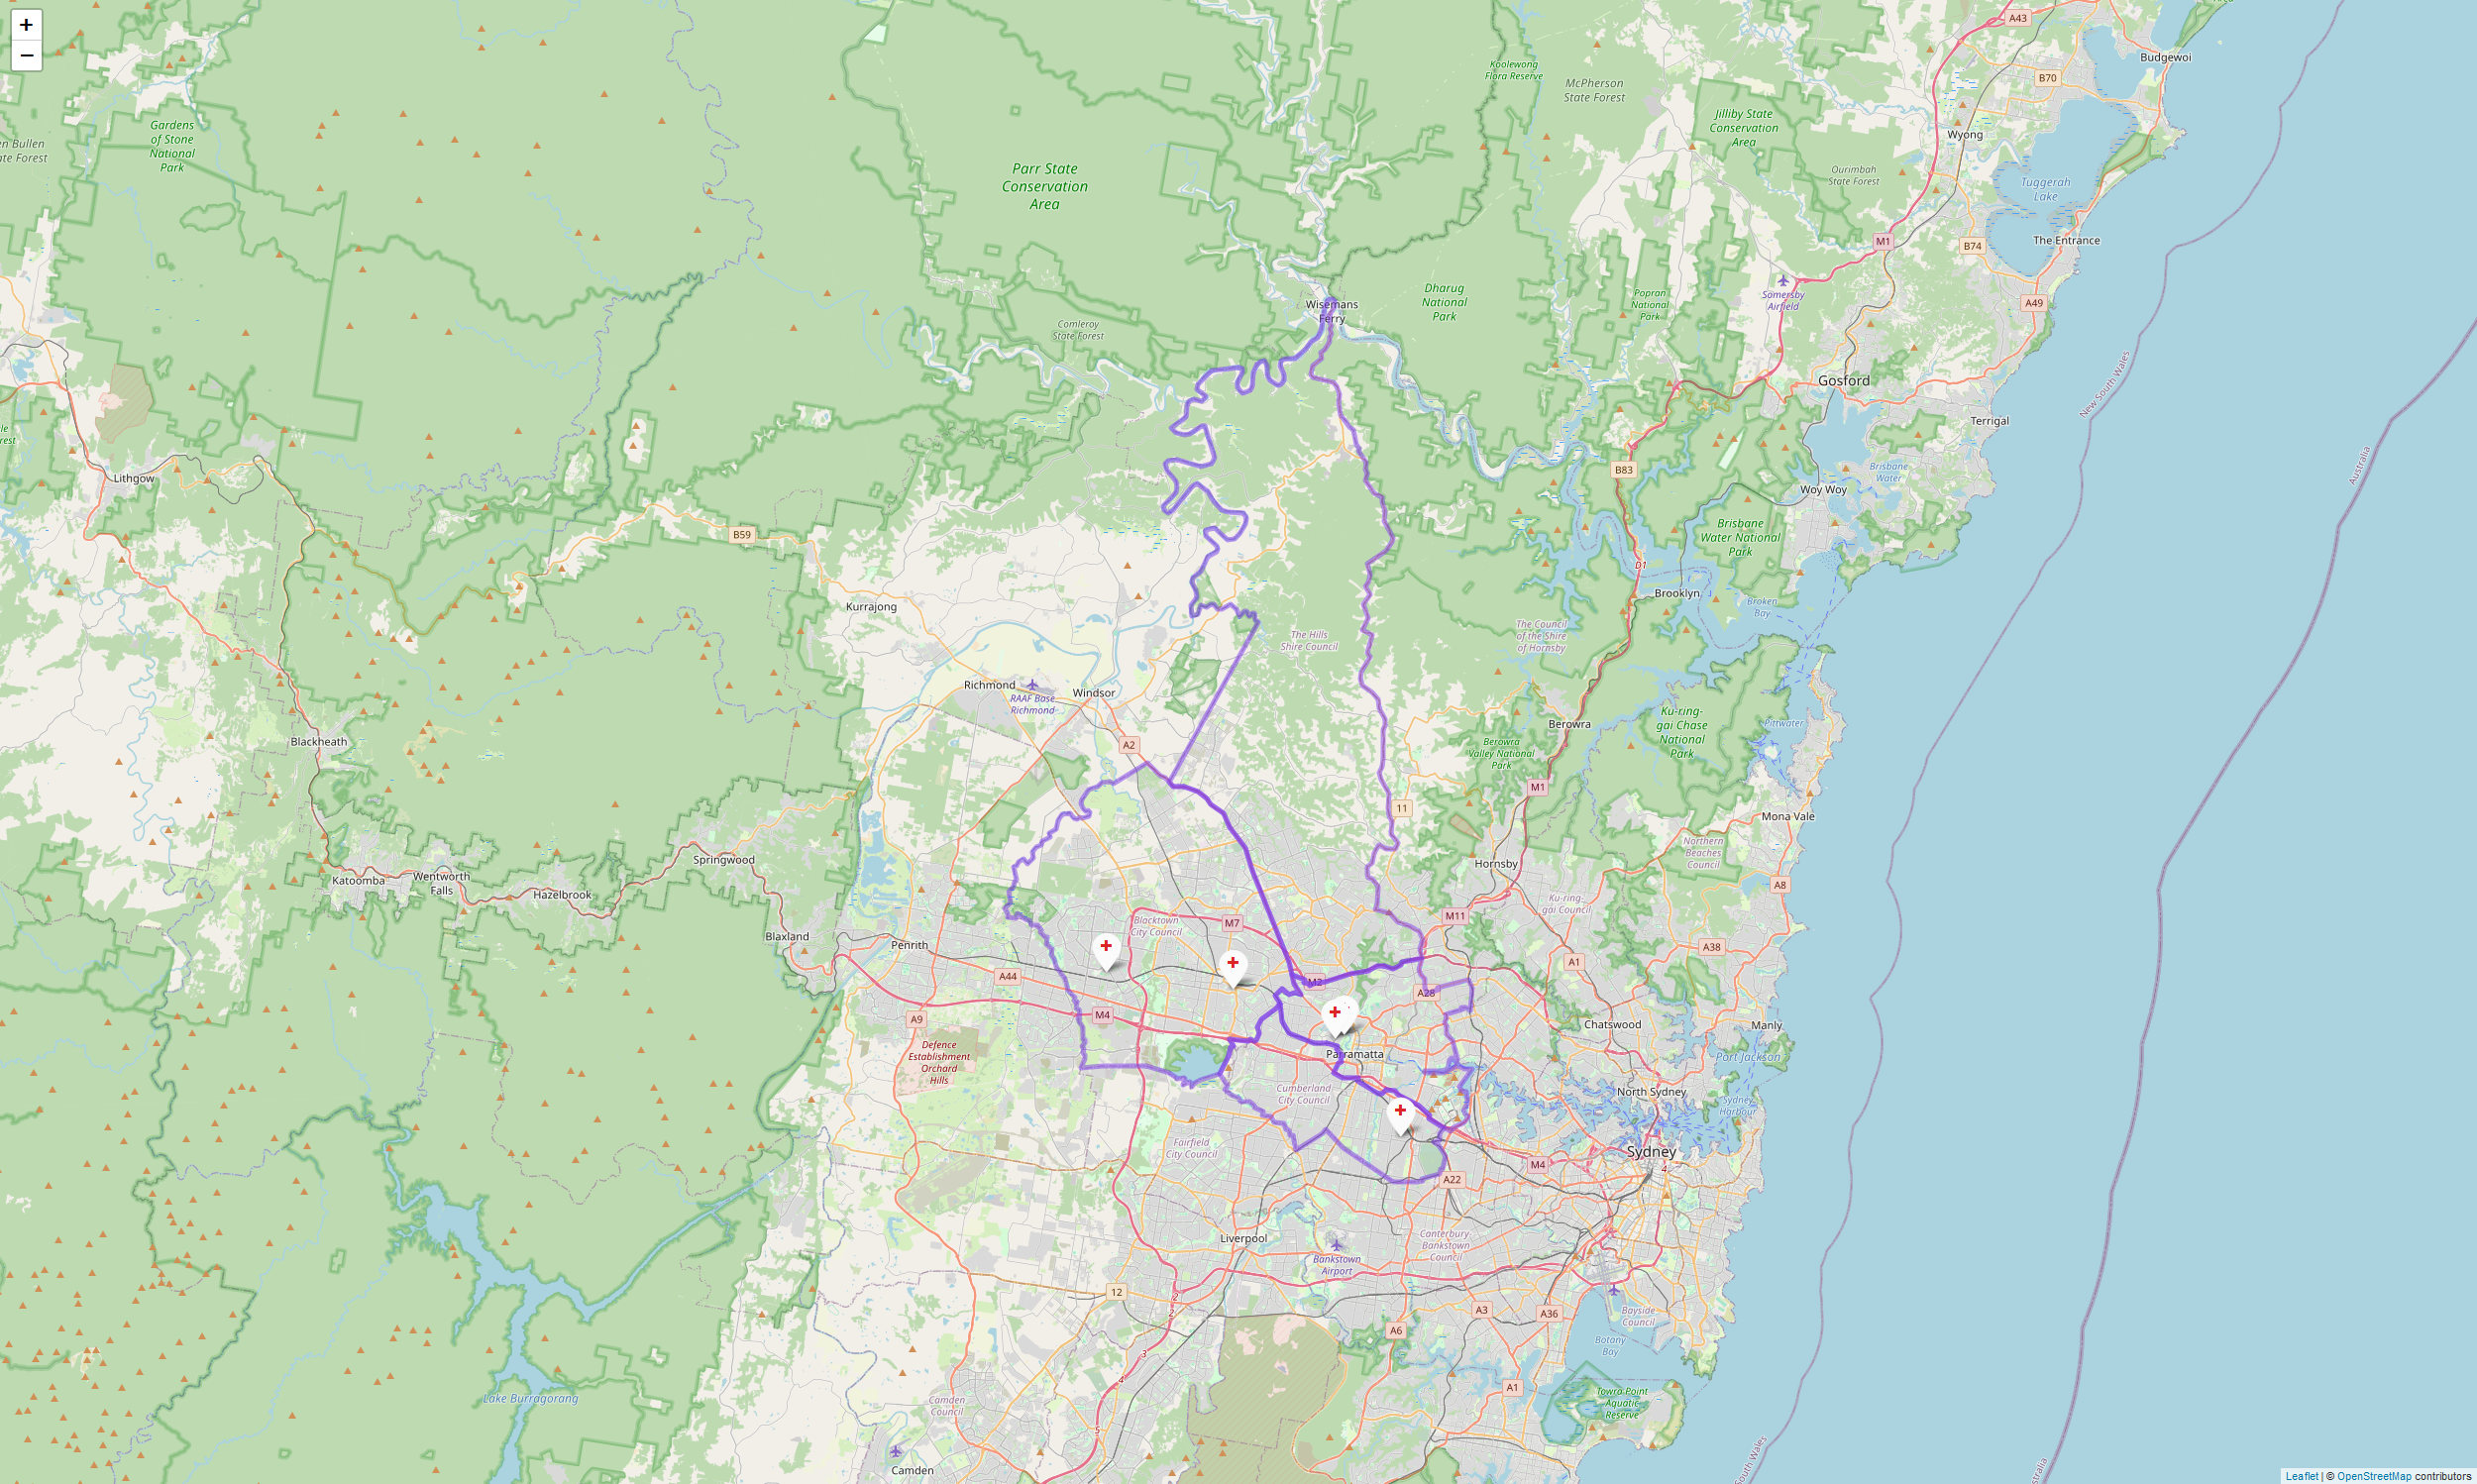
This is a partial map of New South Wales.
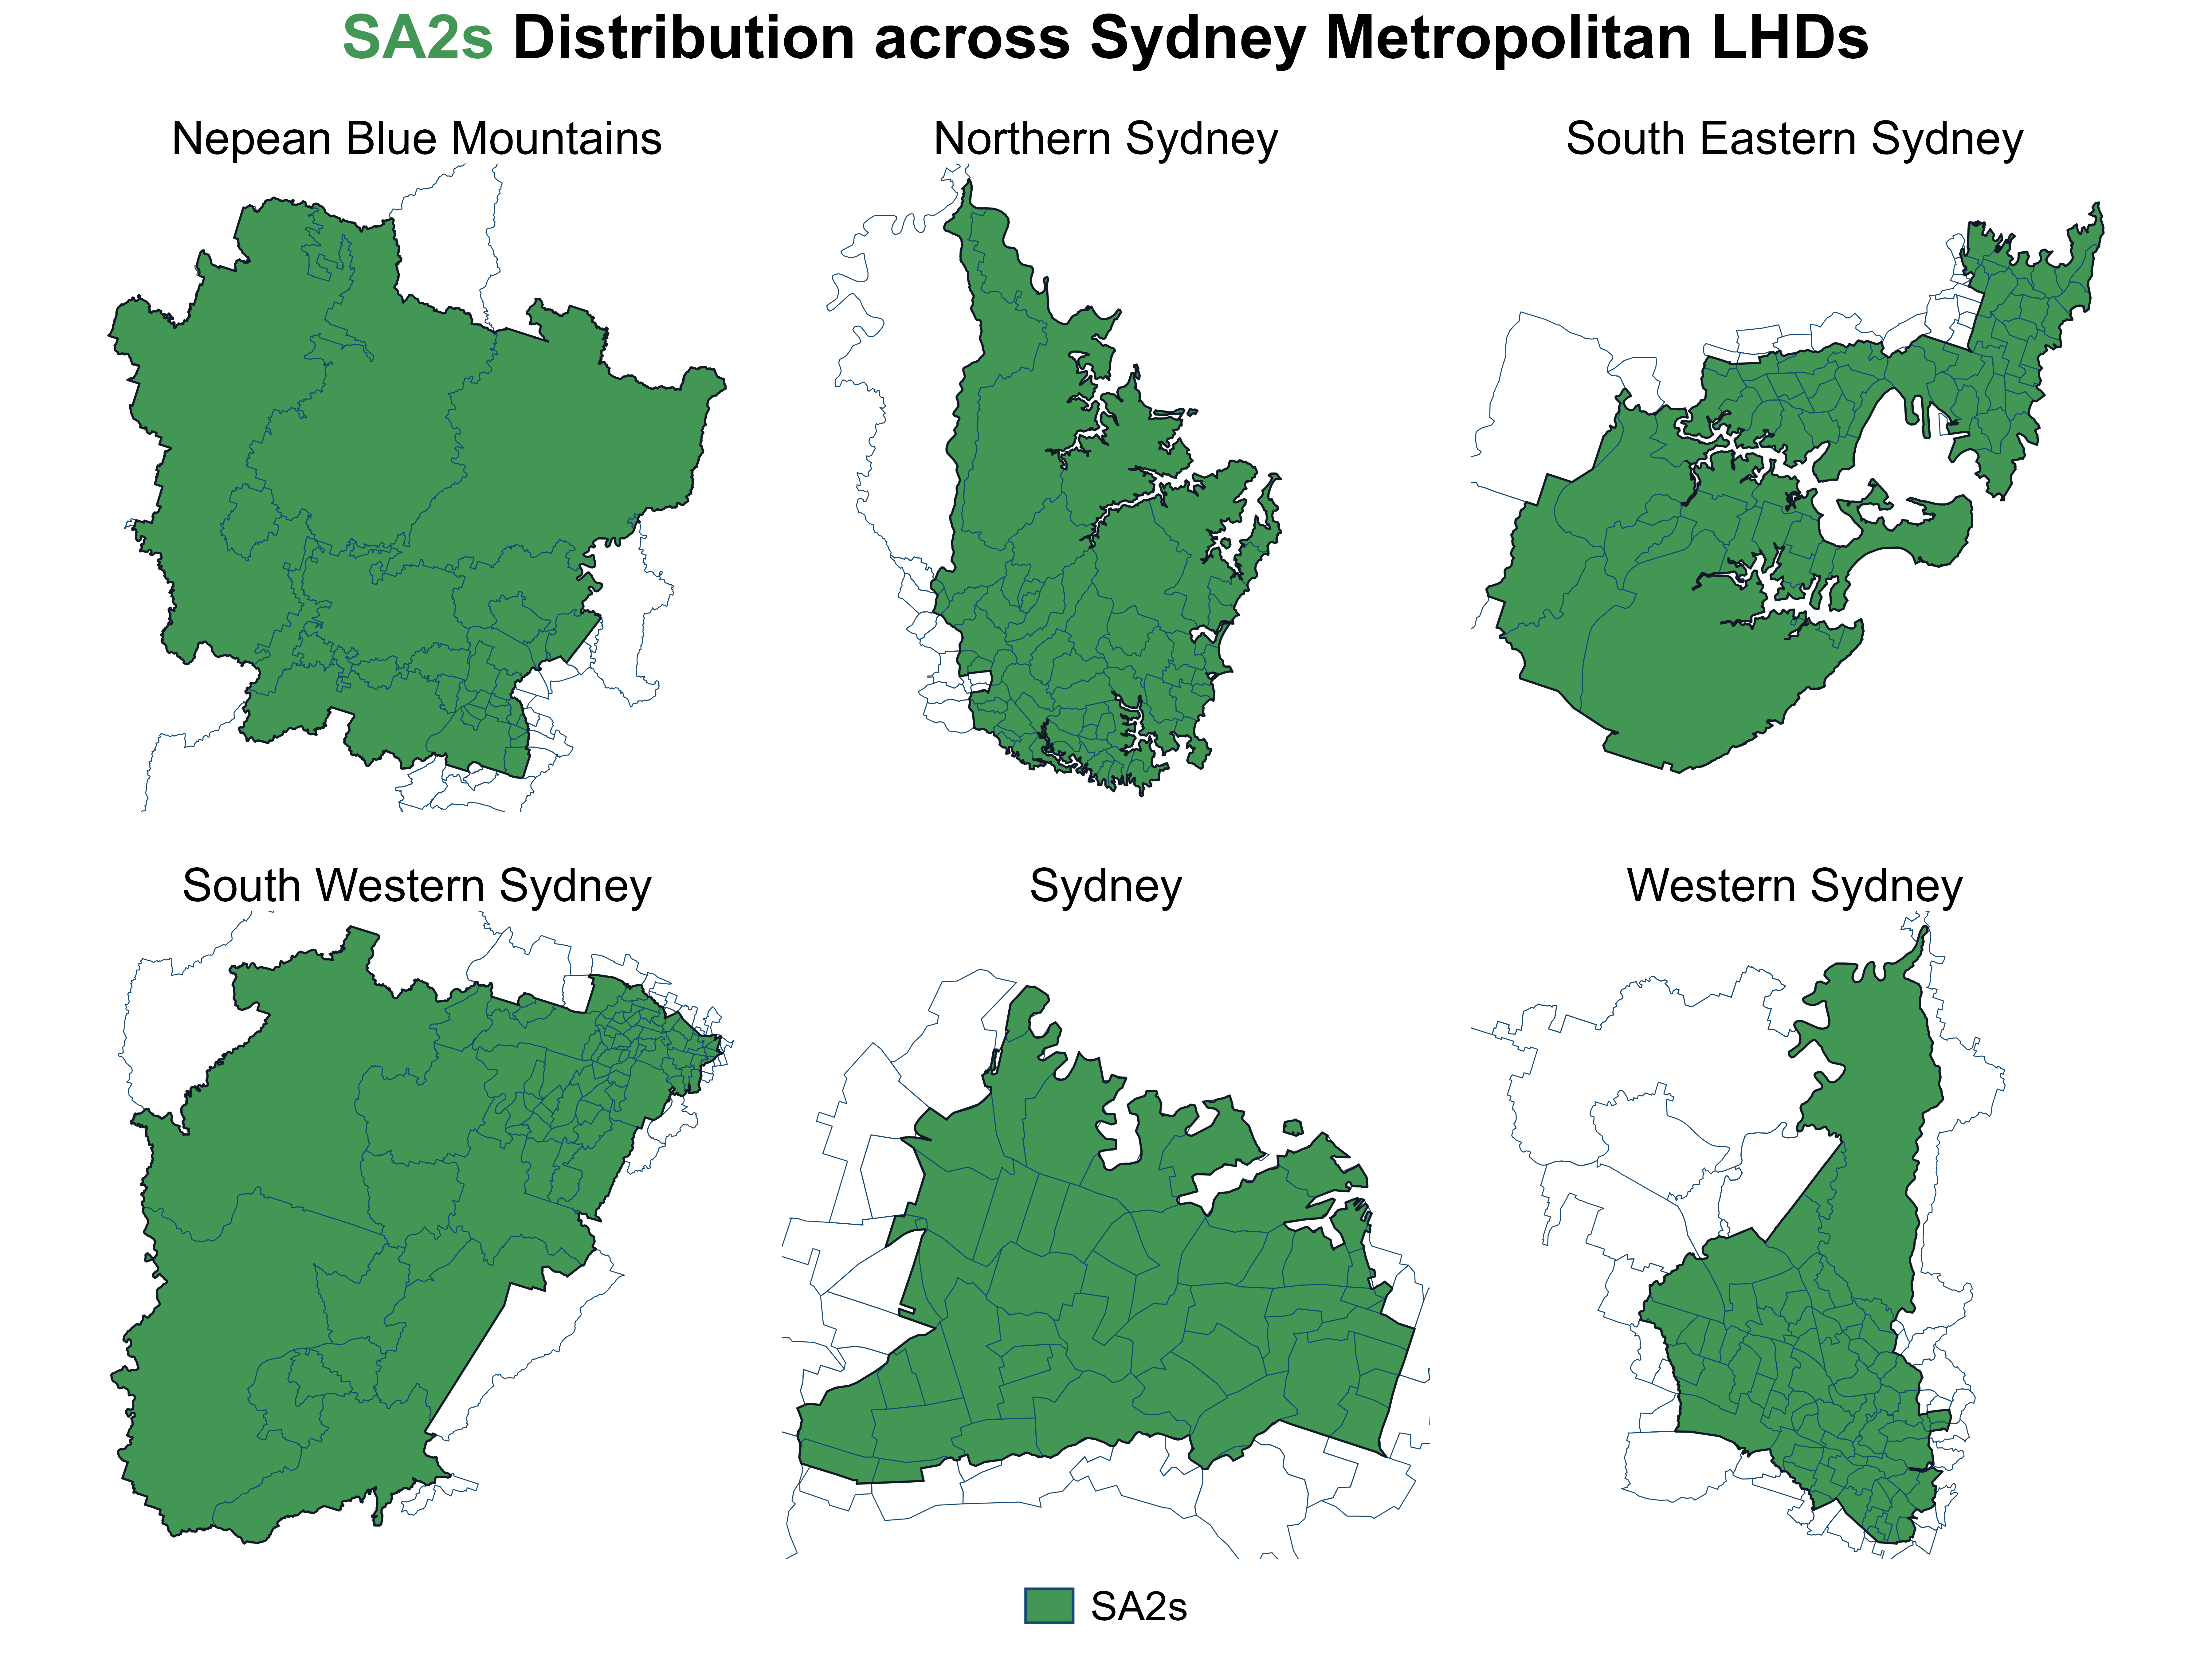
Let’s turn our attention to the areas outlined in purple. They represent the six Sydney Metropolitan Local Health Districts:
- Nepean Blue Mountains
- Northern Sydney
- South Eastern Sydney
- South Western Sydney
- Sydney
- Western Sydney
These six LHDs form the healthcare network of metropolitan Sydney, delivering health services across the region and covering over 60% of NSW’s total population.
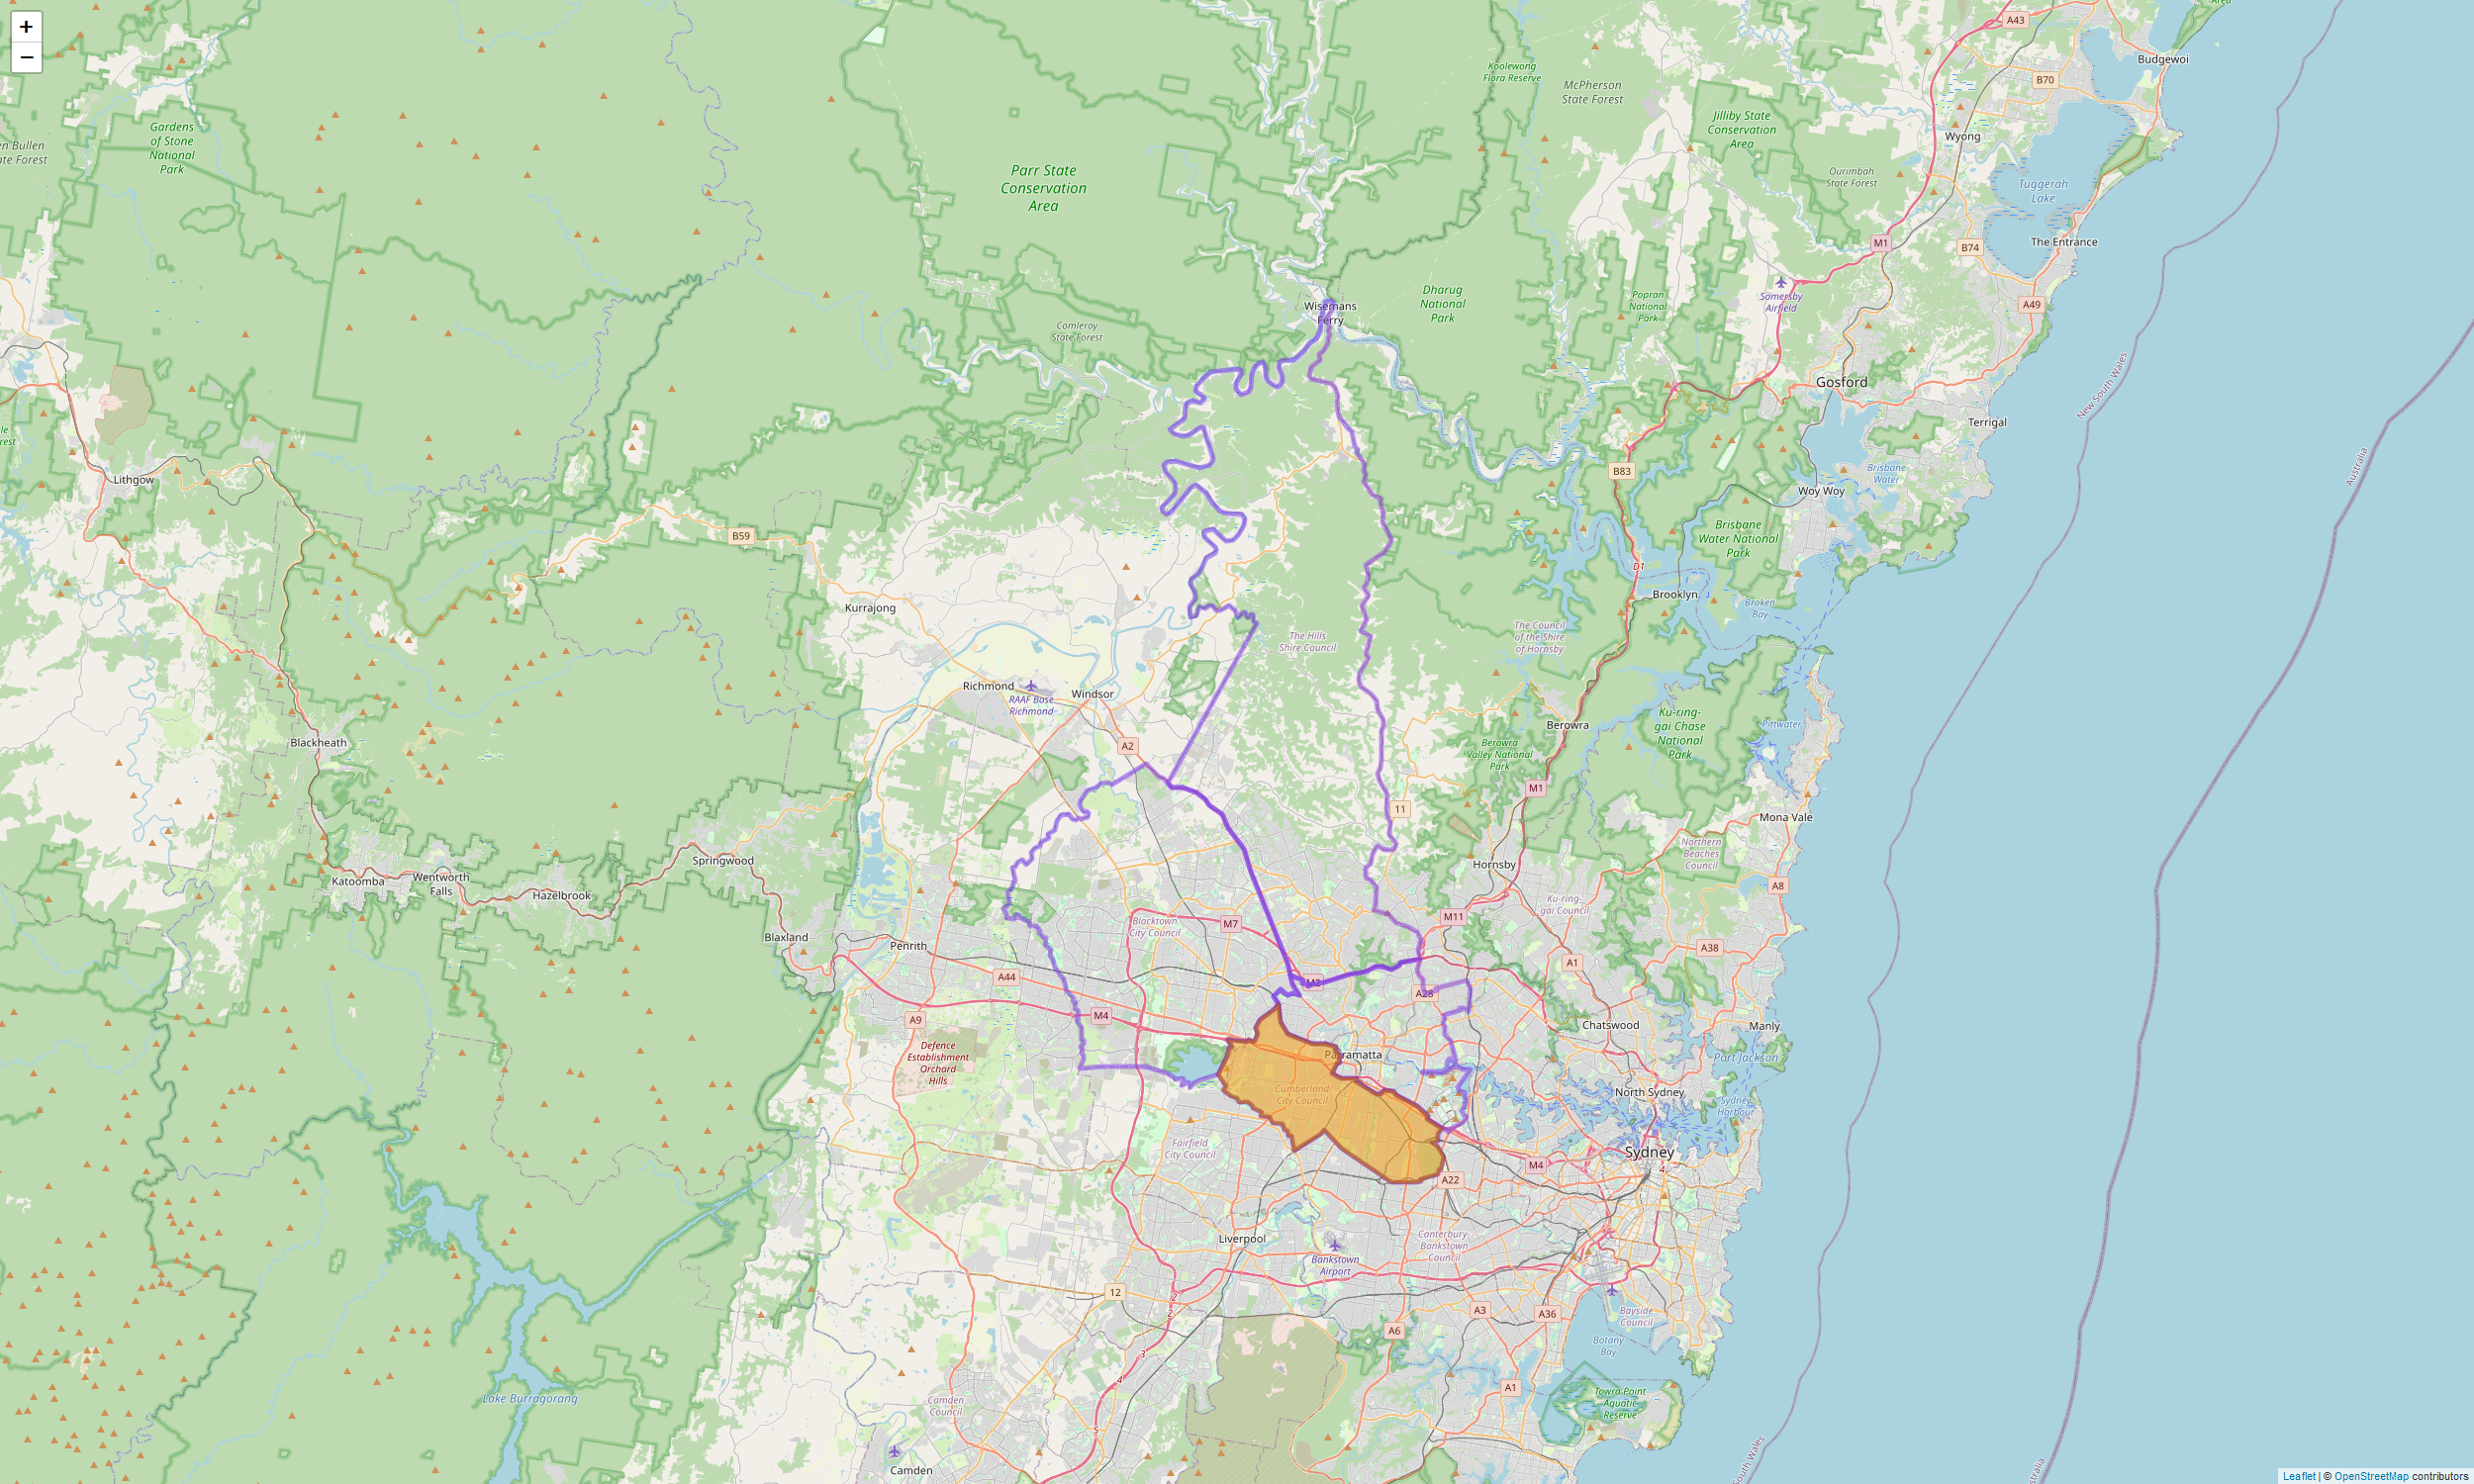
The orange area represents WSLHD, which provides hospital, community, and specialist health services to people living across Western Sydney.
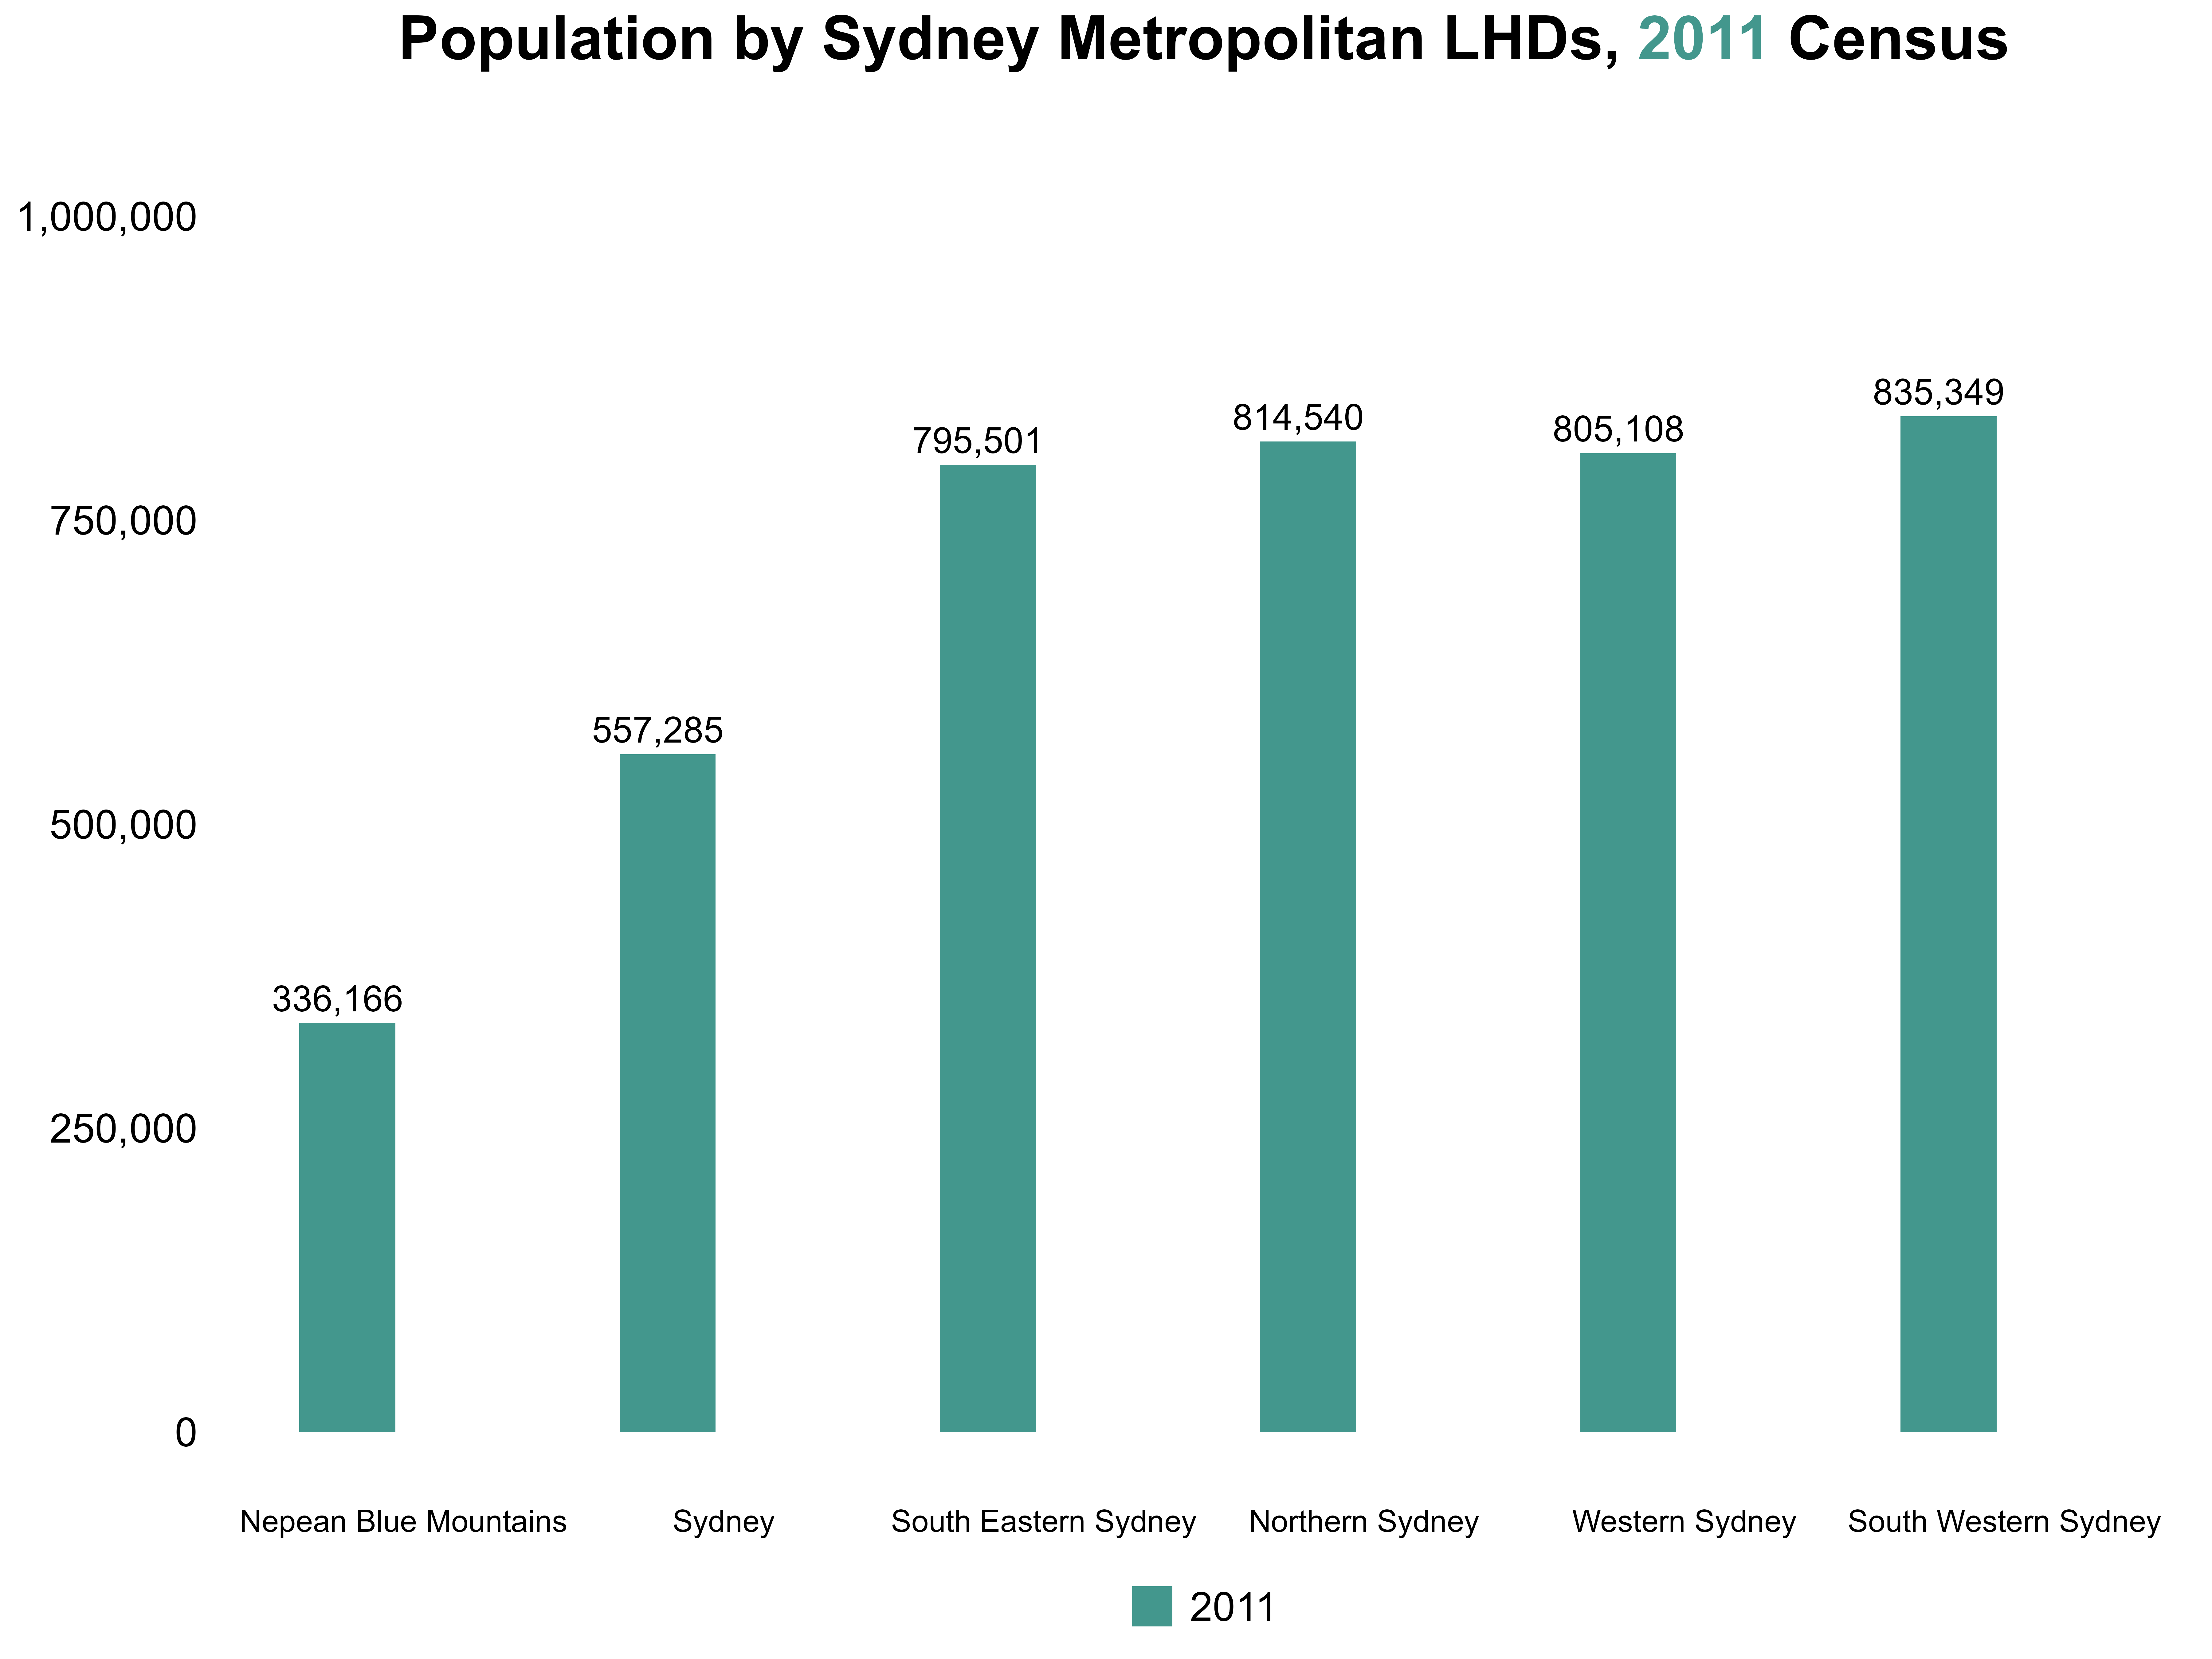
Let’s take a closer look at the population shifts in Sydney metropolitan from 2011 to 2021.
According to the 2011 Census, around 4.14 million people lived in the metropolitan region, accounting for more than 60% of the entire NSW population.
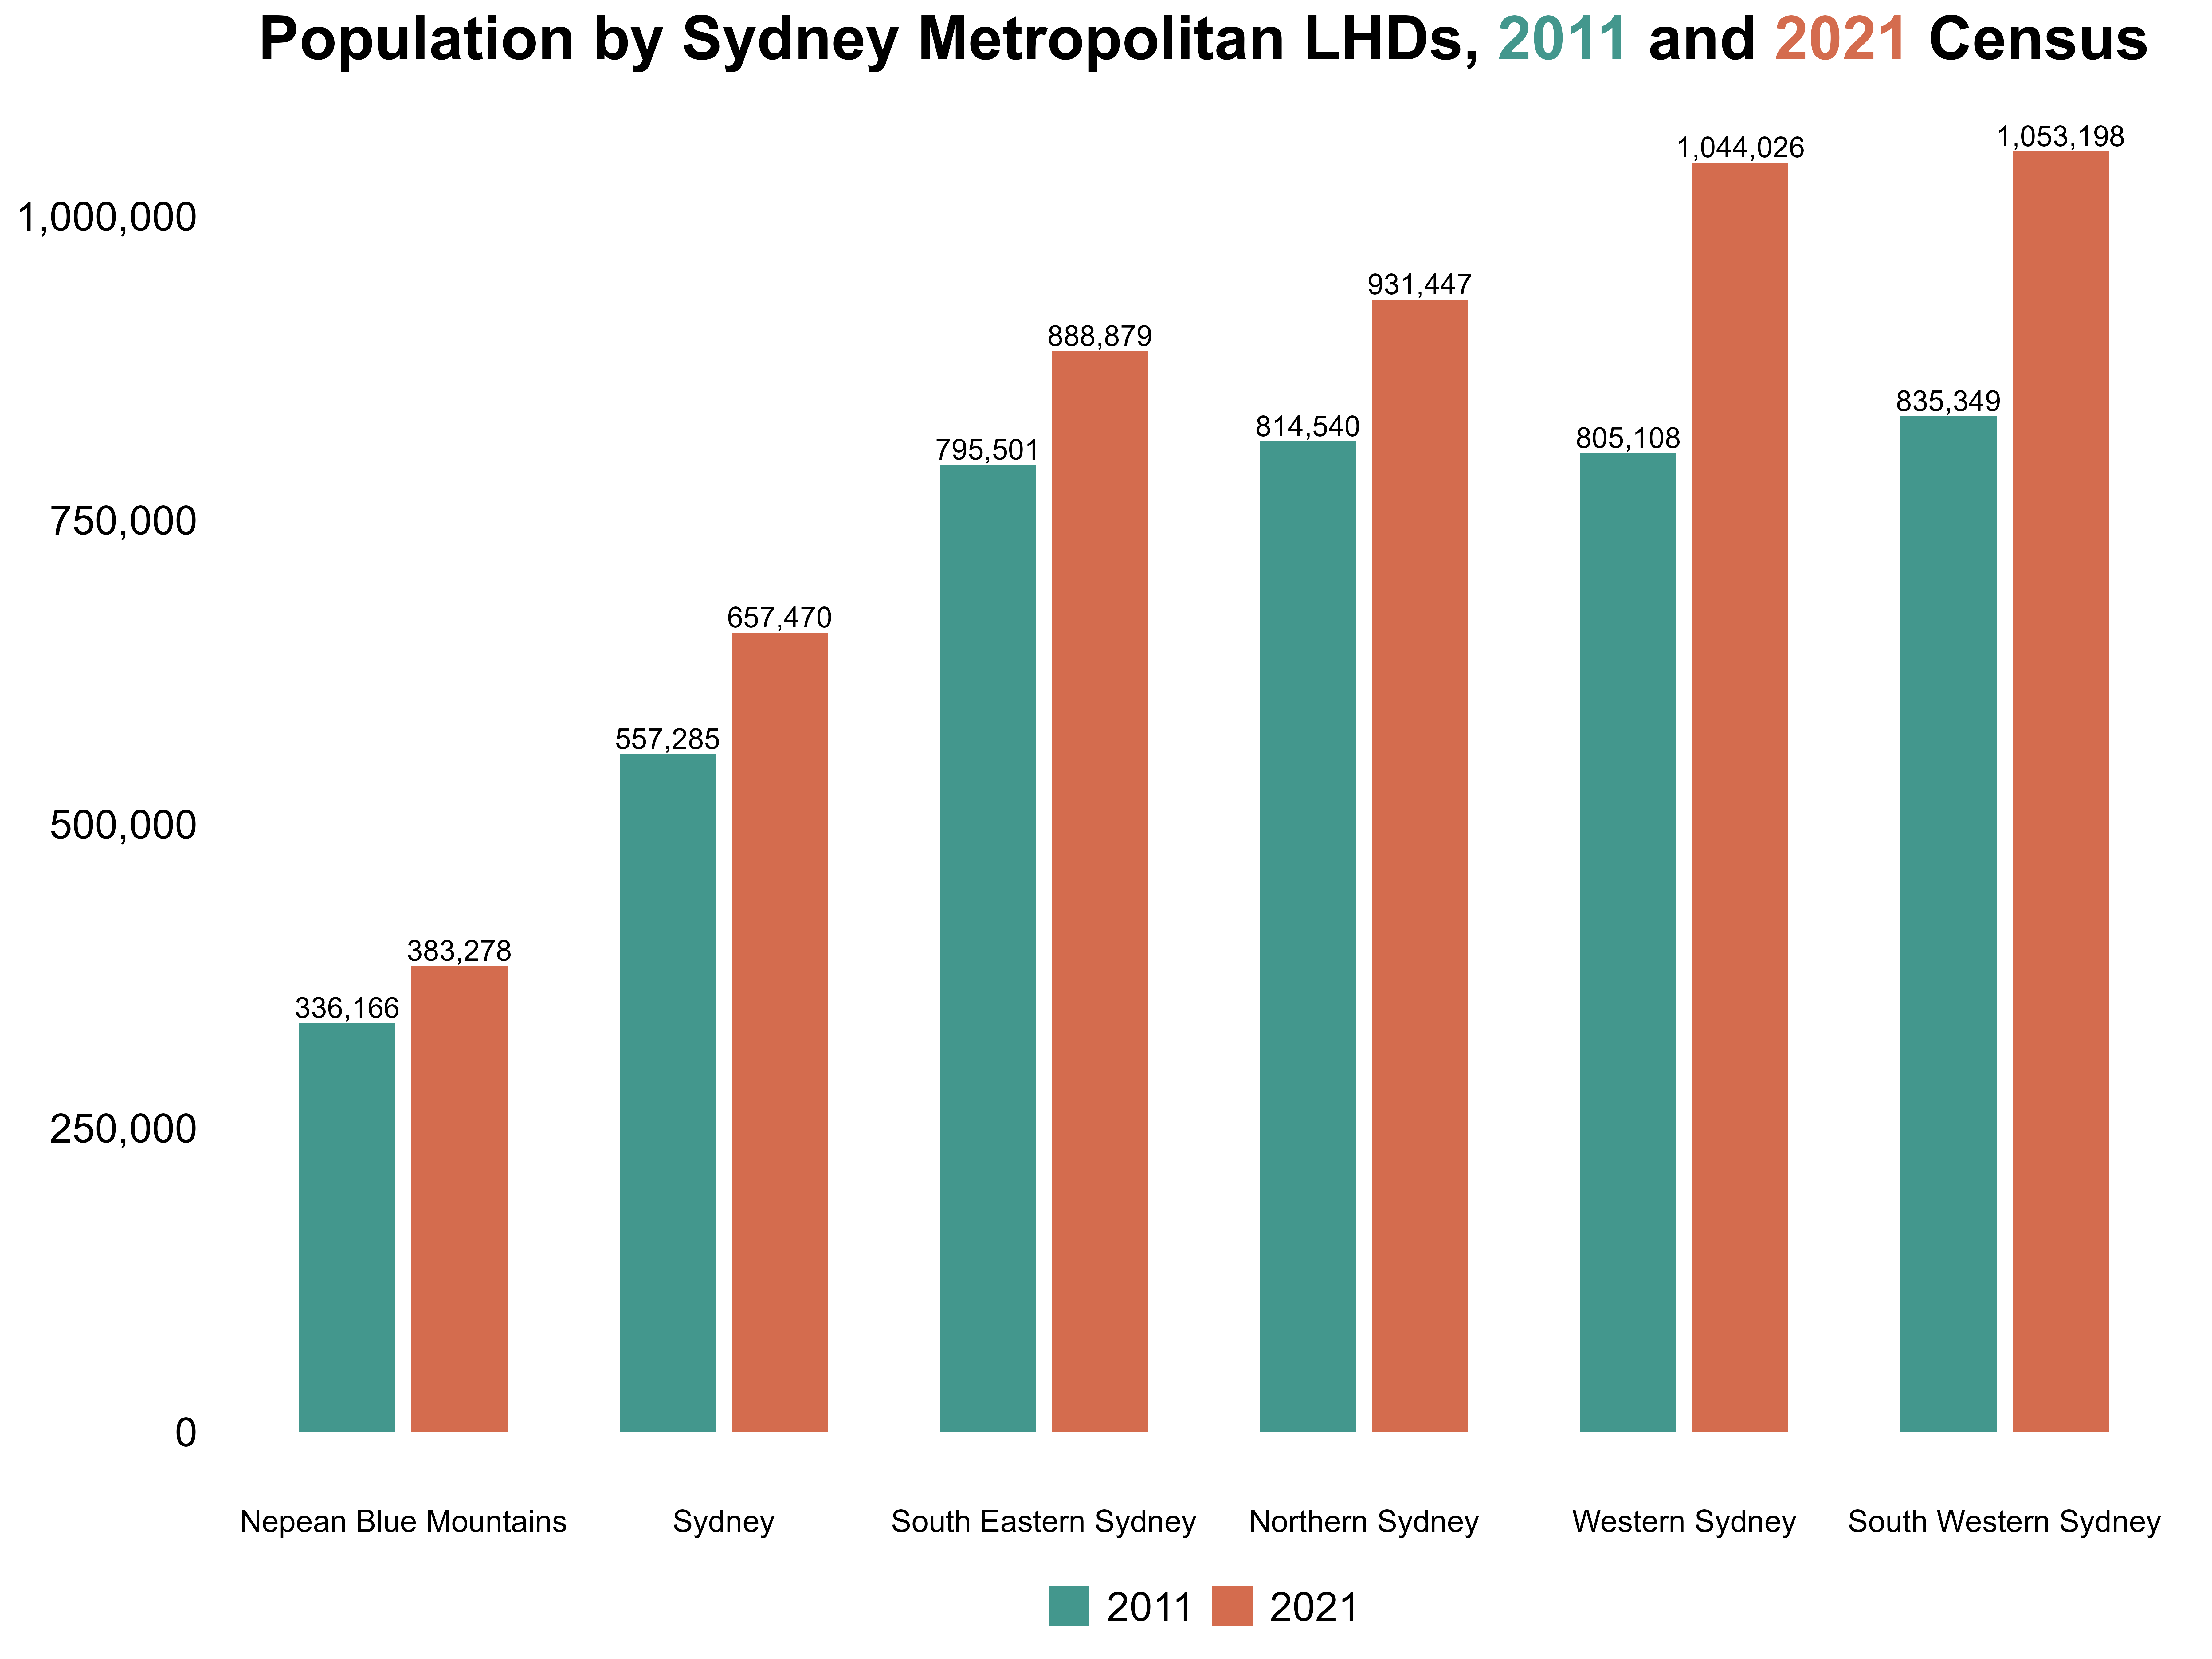
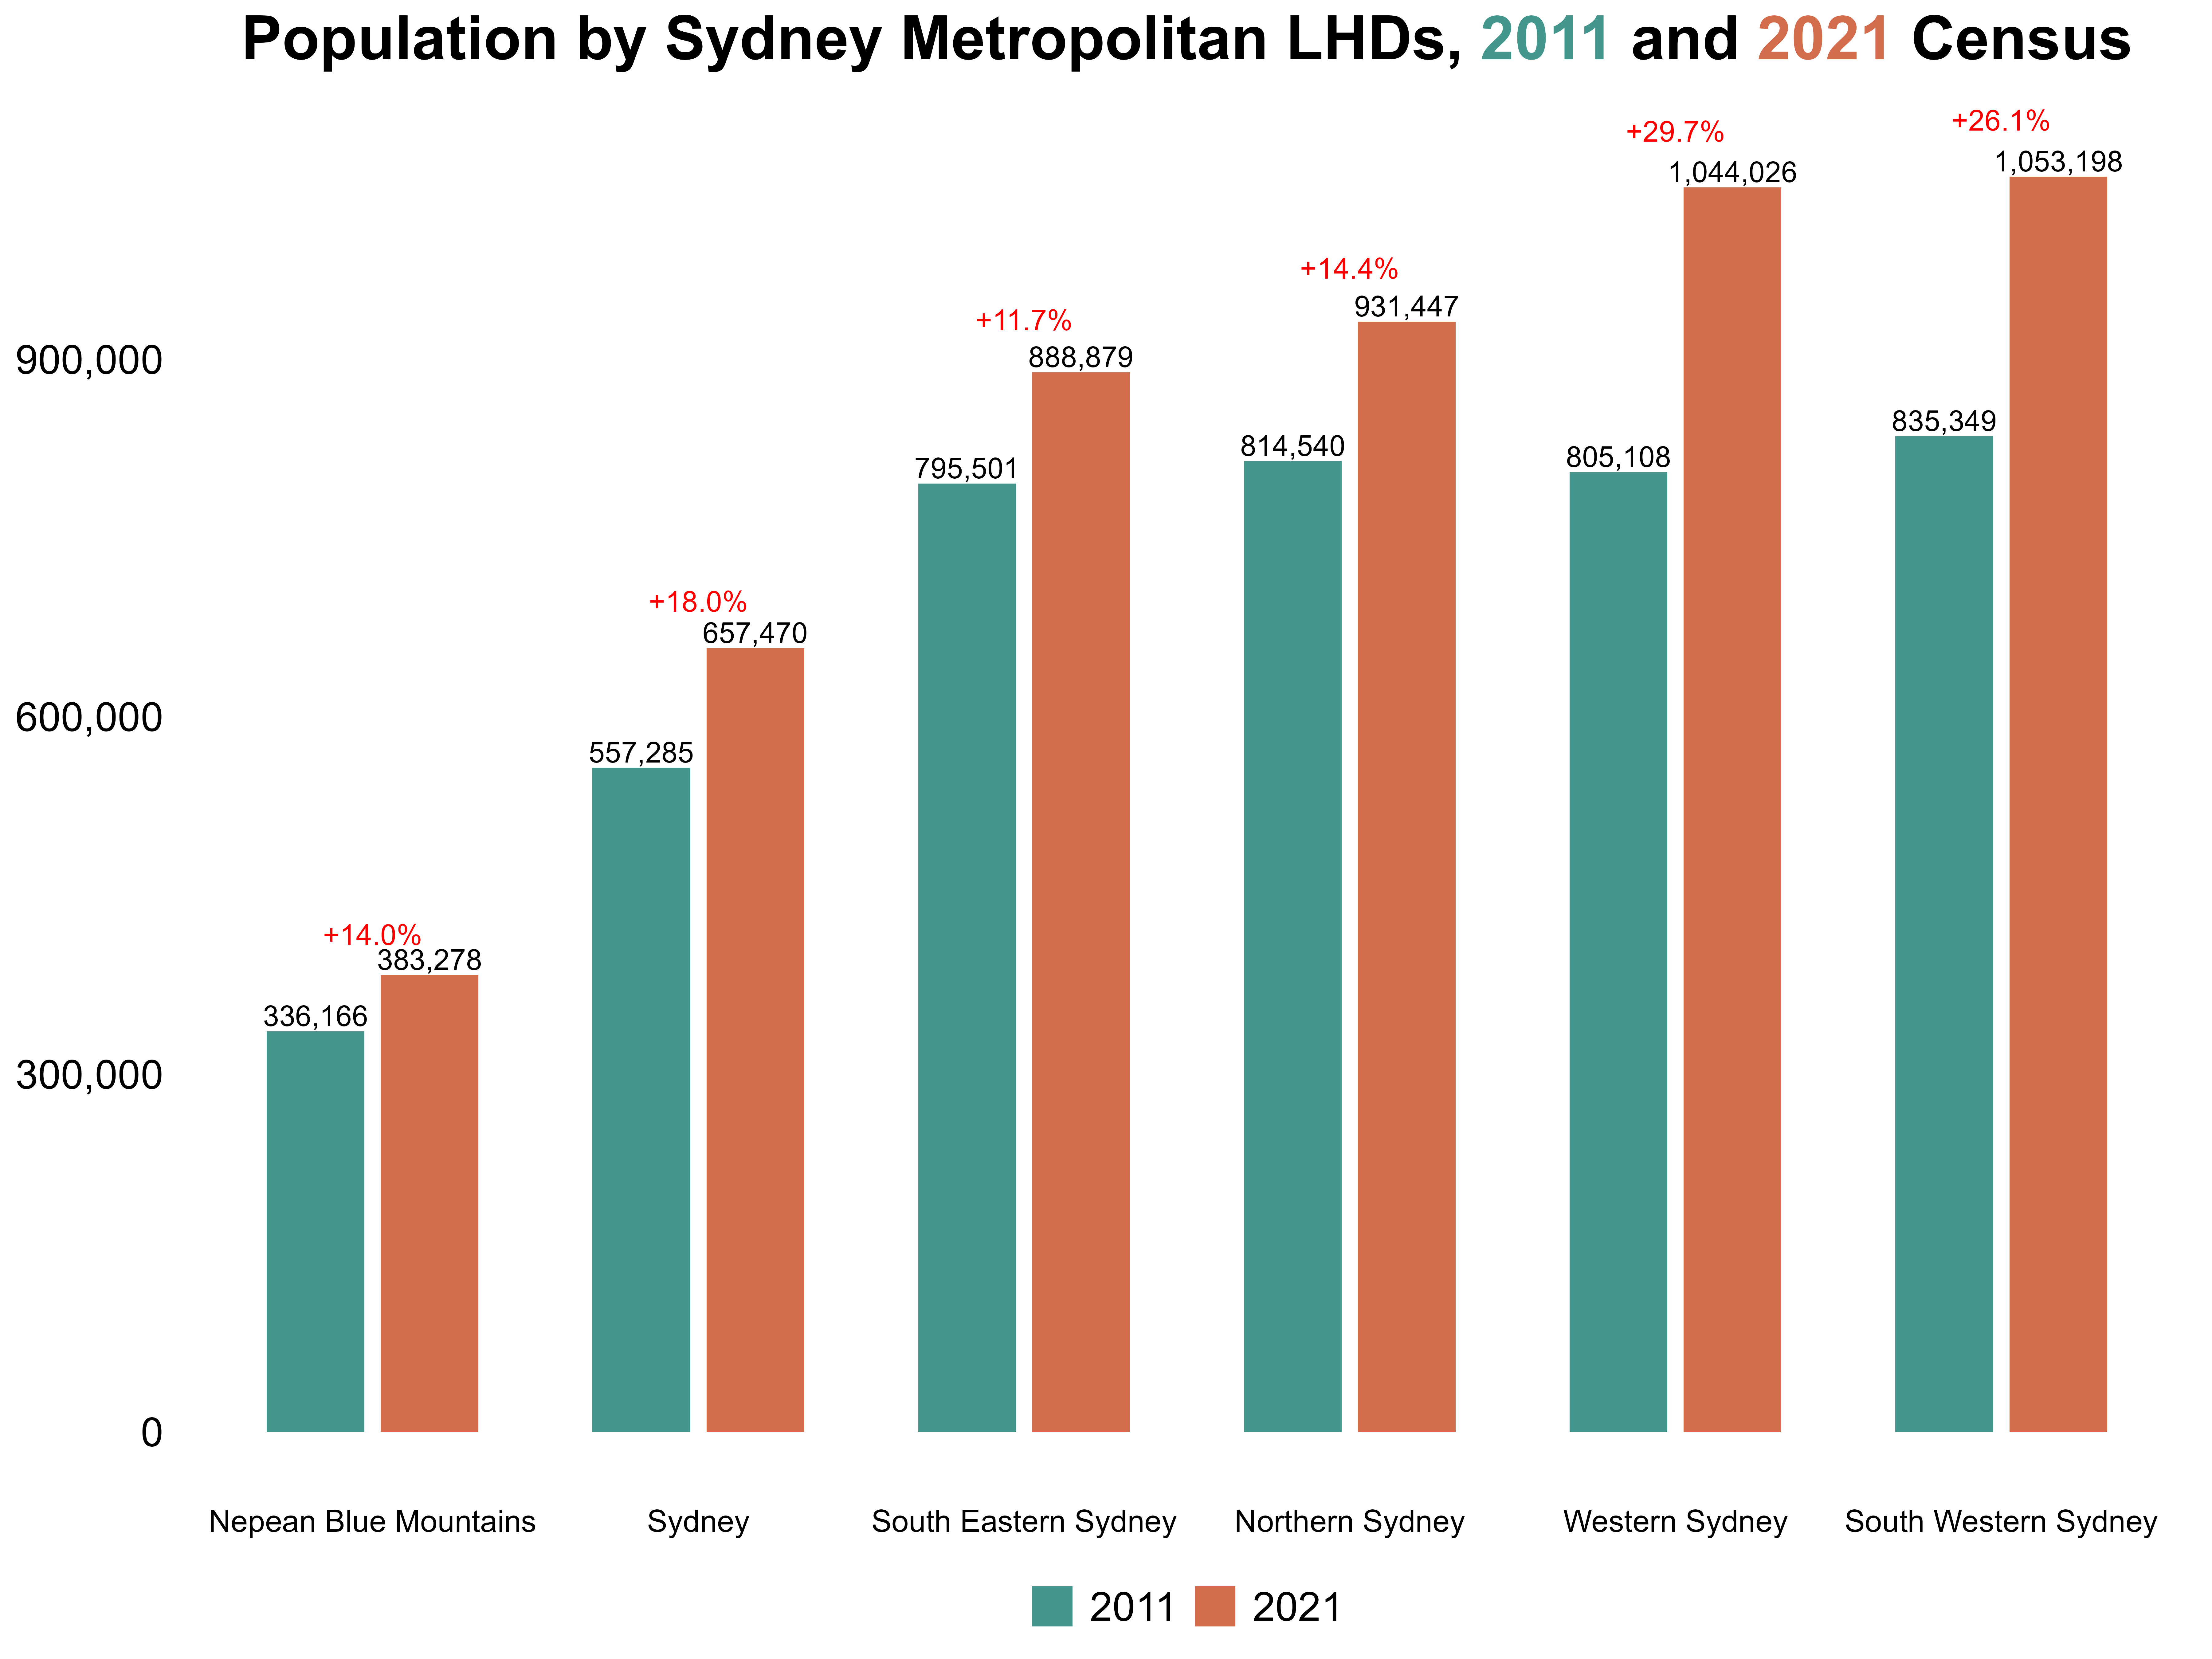
By 2021, that metropolitan population had grown to 4.96 million, an additional 800,000 people in just ten years.
Western Sydney and South Western Sydney alone each passed the milestone of 1 million residents.
Western Sydney’s population growth rate alone has reached closely 30%.
Next, let’s break down the metropolitan region in more detail.
Each Local Health District can be mapped using Statistical Area Level 2 (SA2) boundaries.
Defined by the ABS, an SA2 represents a community where people live, work, and interact socially and economically.
While SA2s do not always fit neatly within a single LHD, they provide a useful way to examine communities at a smaller geographic scale.
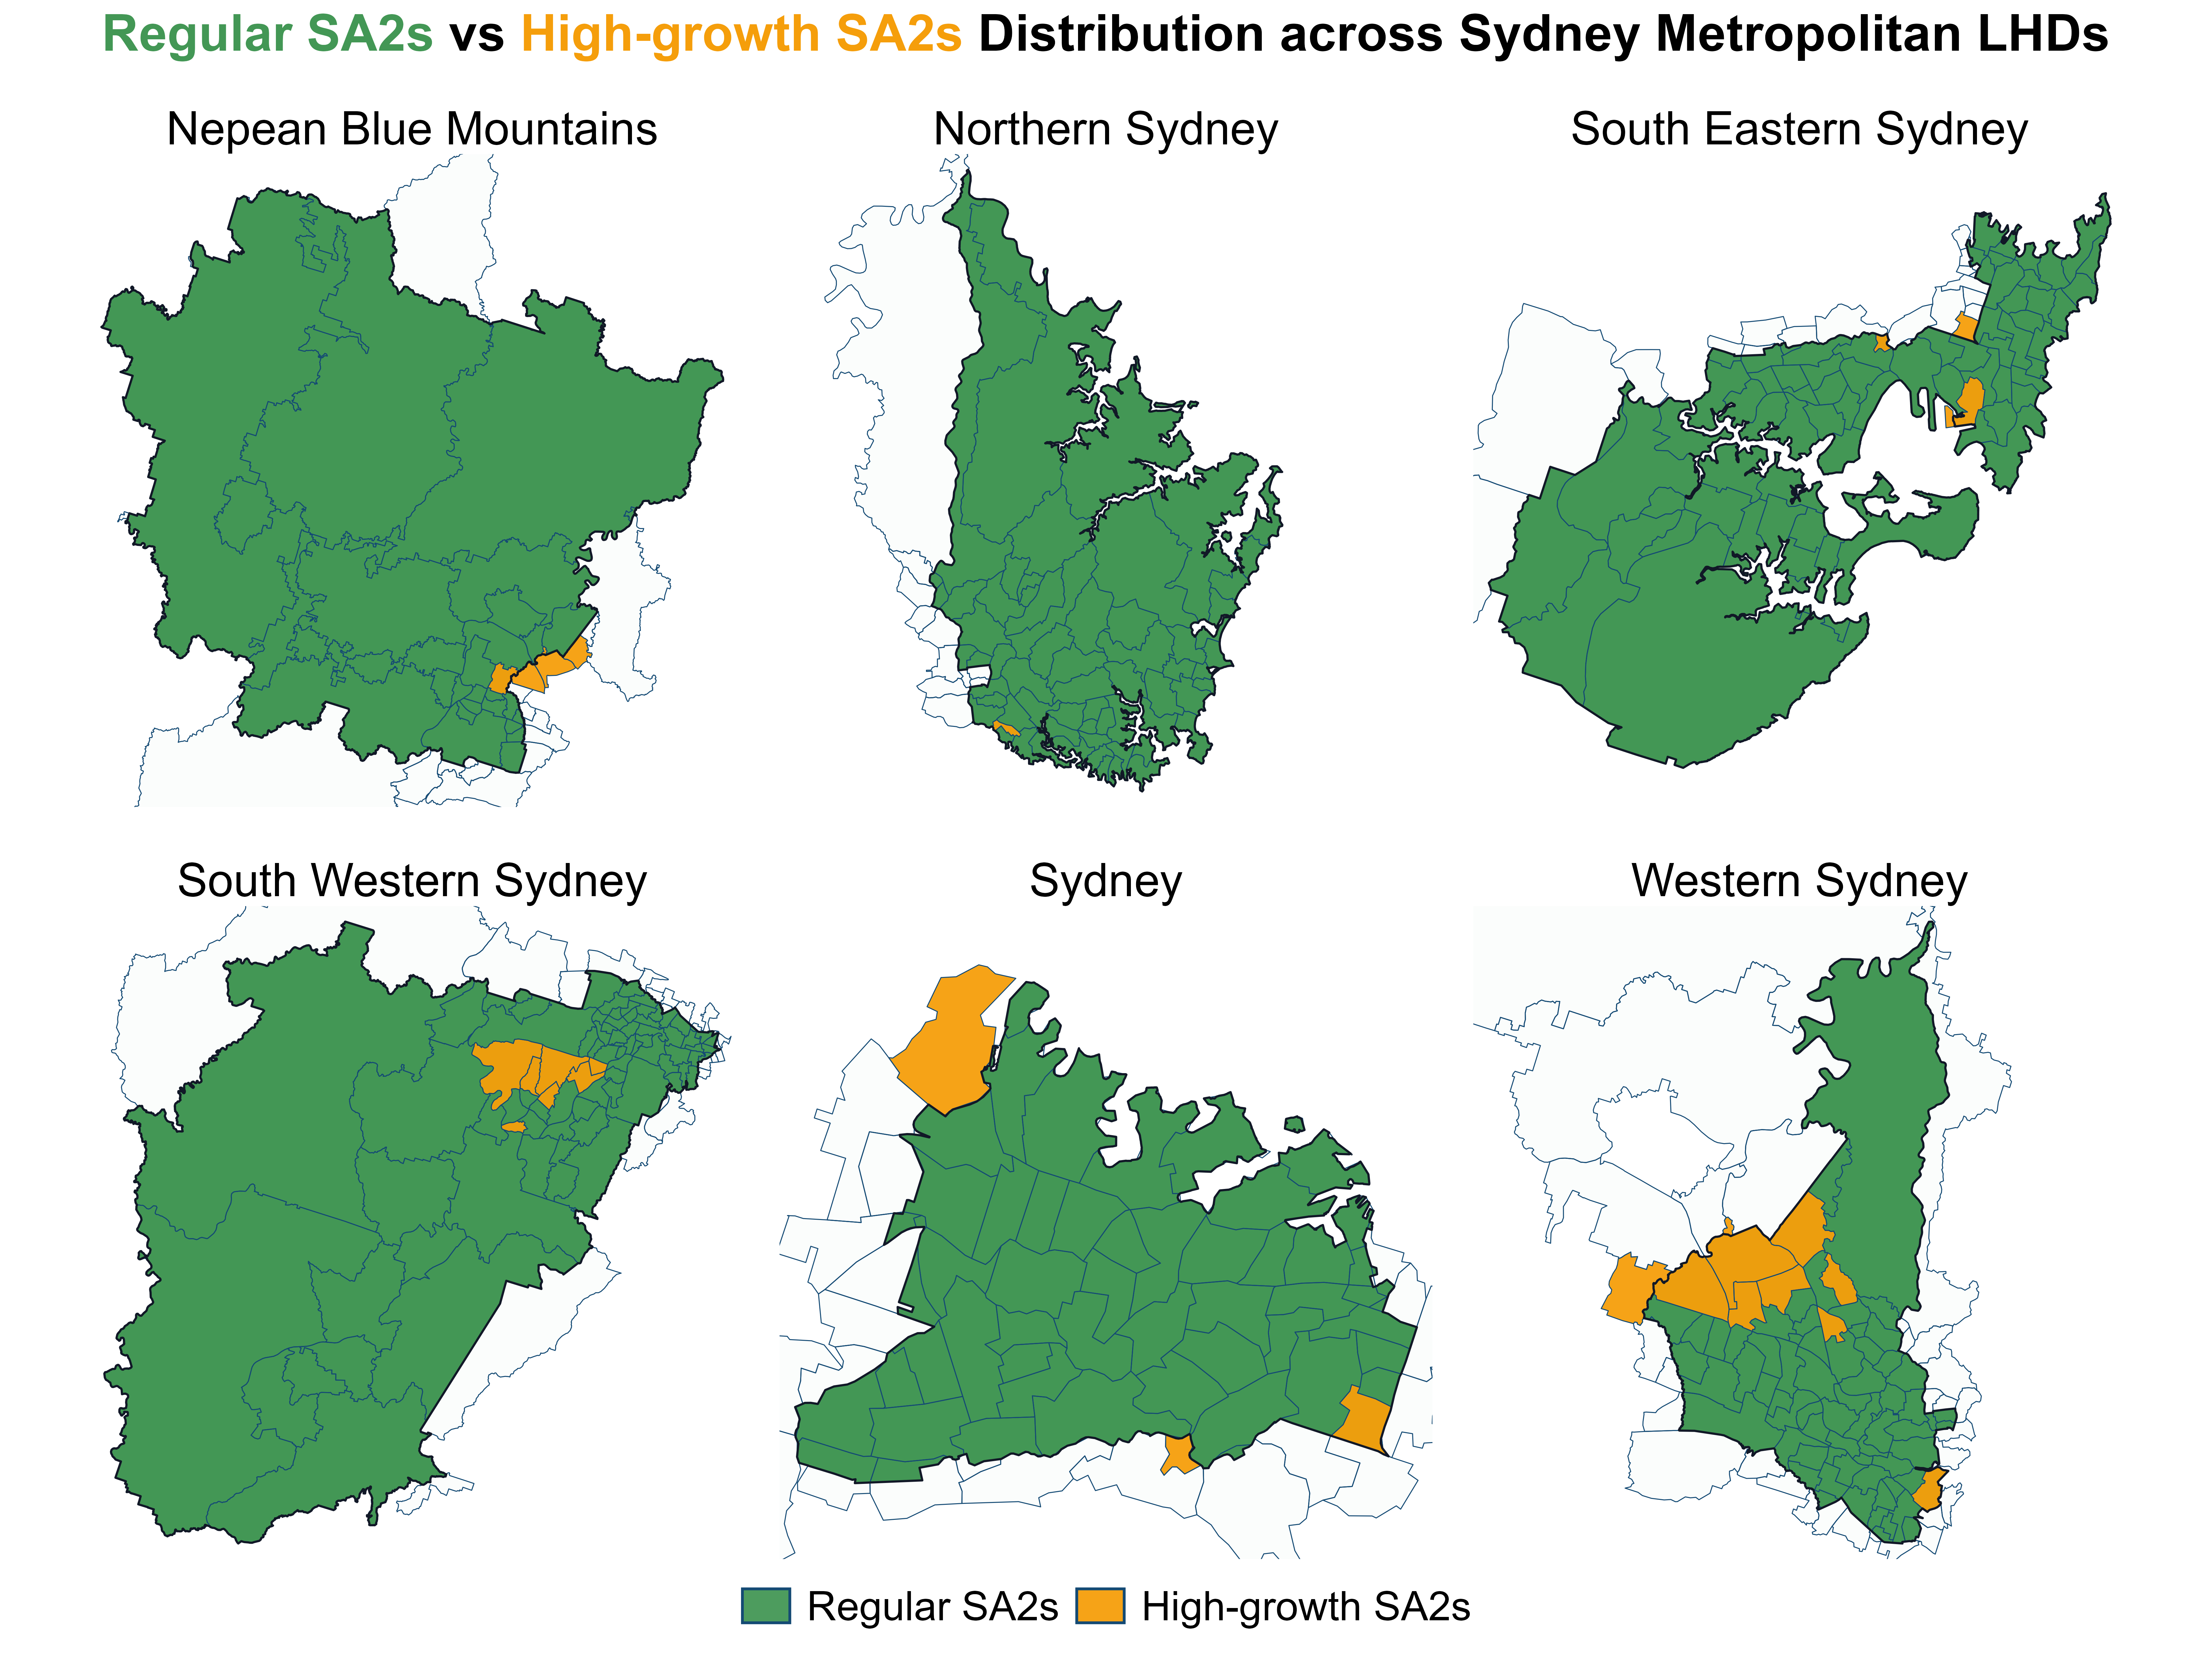
I calculated SA2-level population growth rates to pinpoint the fastest-growing areas.
I identified high-growth SA2s with growth rate exceeding 100%.
Also, we can find that most of high-growth SA2s are concentrated in Western Sydney.
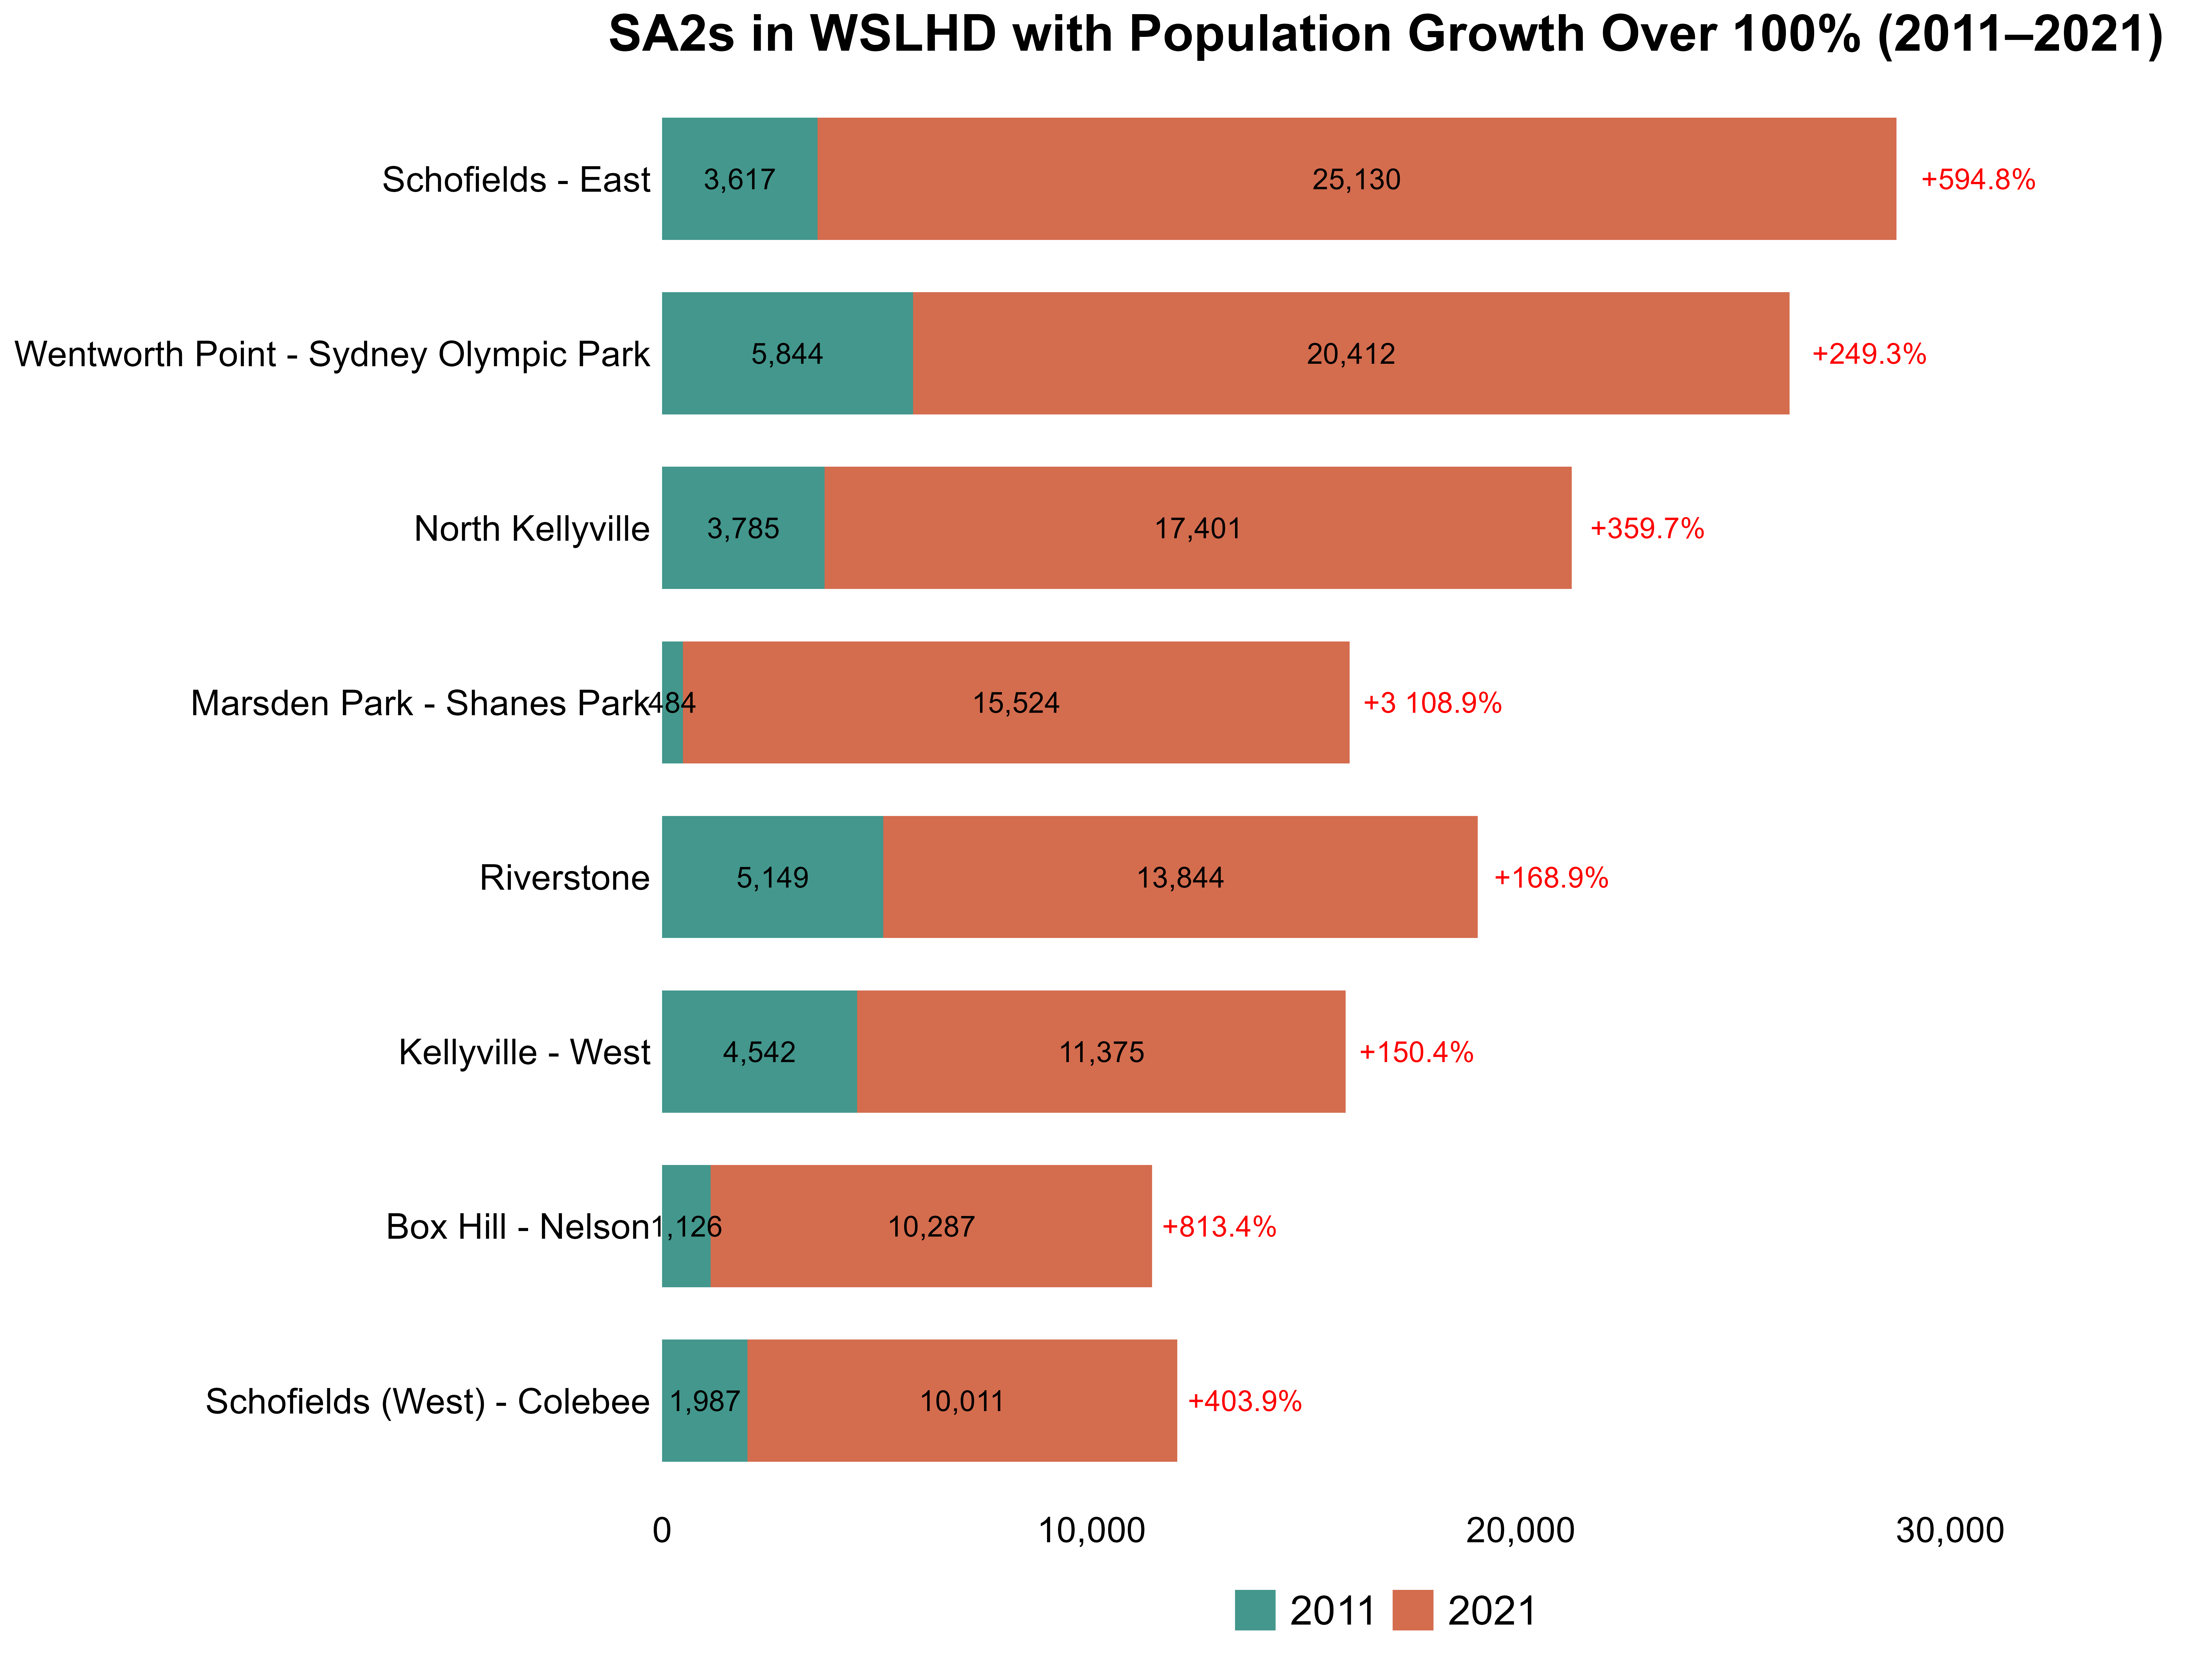
Next, let’s focus on the high-growth SA2s within Western Sydney.
Back in 2011, the population of these eight SA2s were all under 10,000. Over just ten years, these communities grew at an extraordinary pace.
This rapid change reflects Western Sydney’s enormous growth and highlights the potential challenges faced by the LHD to deliver services to this rapidly growing and evolving population, with particular attention to sociodemographic patterns.
Now, let’s break down WSLHD.
WSLHD is responsible for delivering public healthcare across 4 local government areas (LGAs):
- Blacktown
- The Hills Shire
- Parramatta
- Cumberland
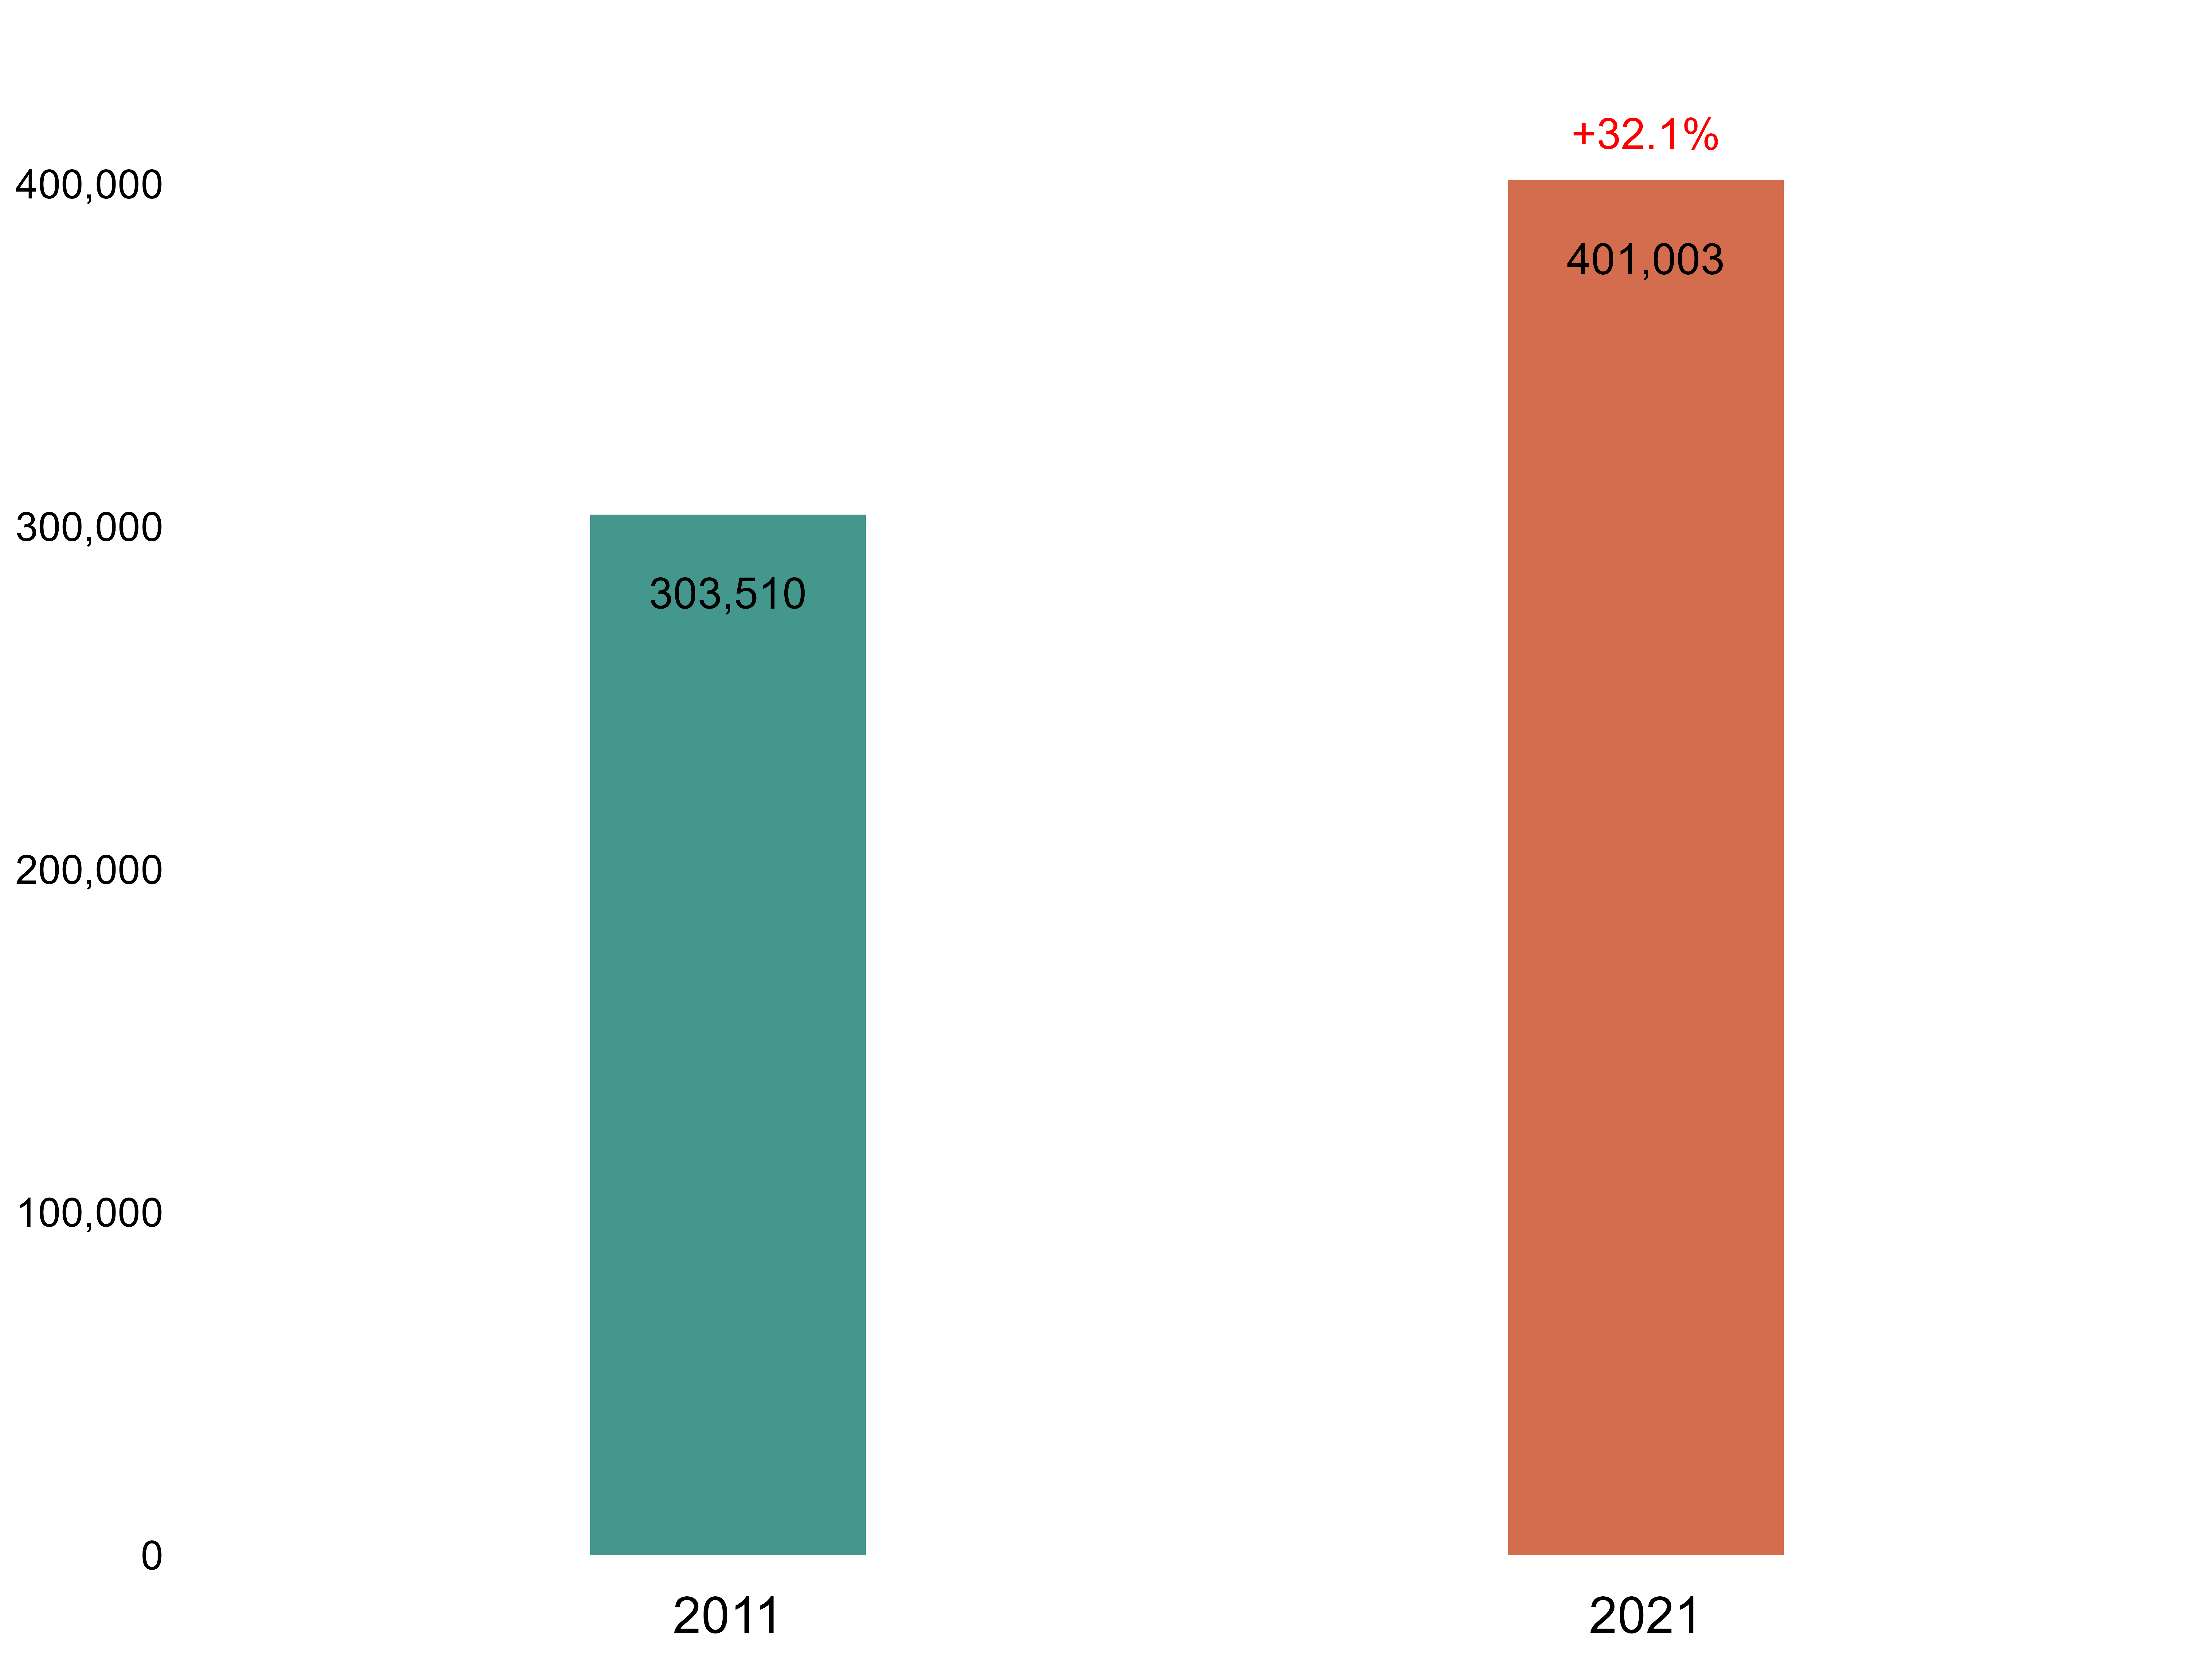
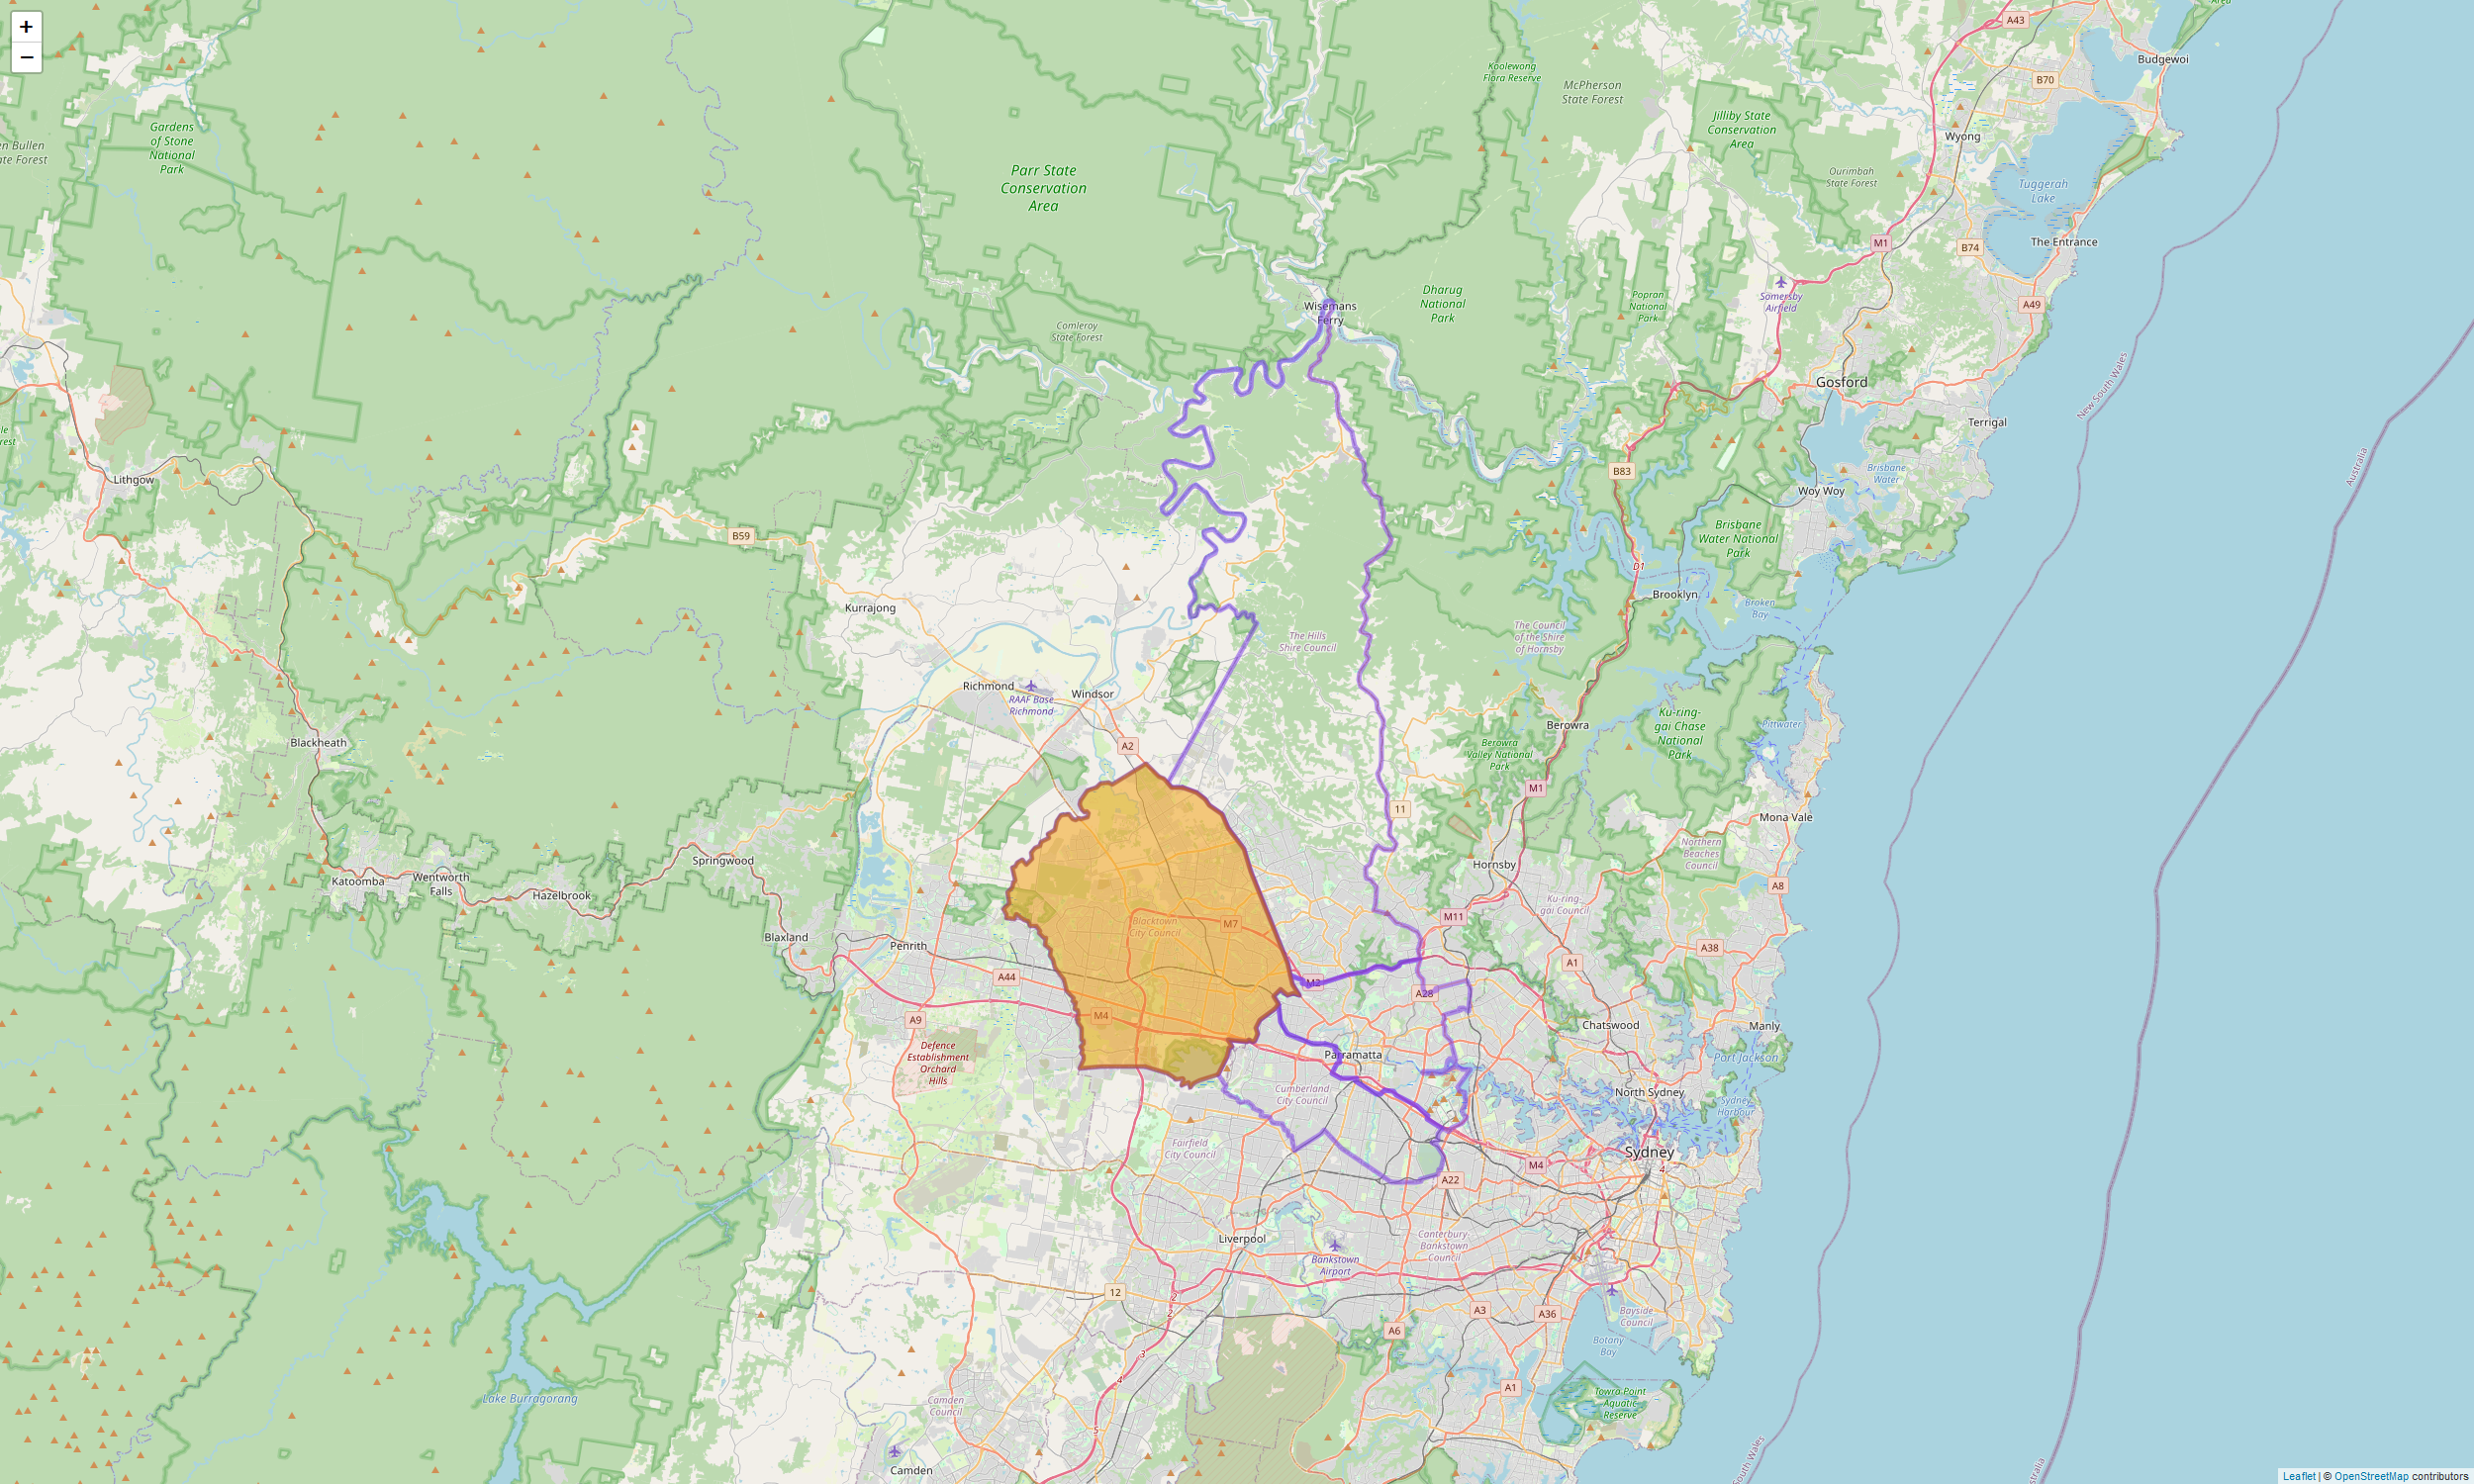
This is Blacktown.
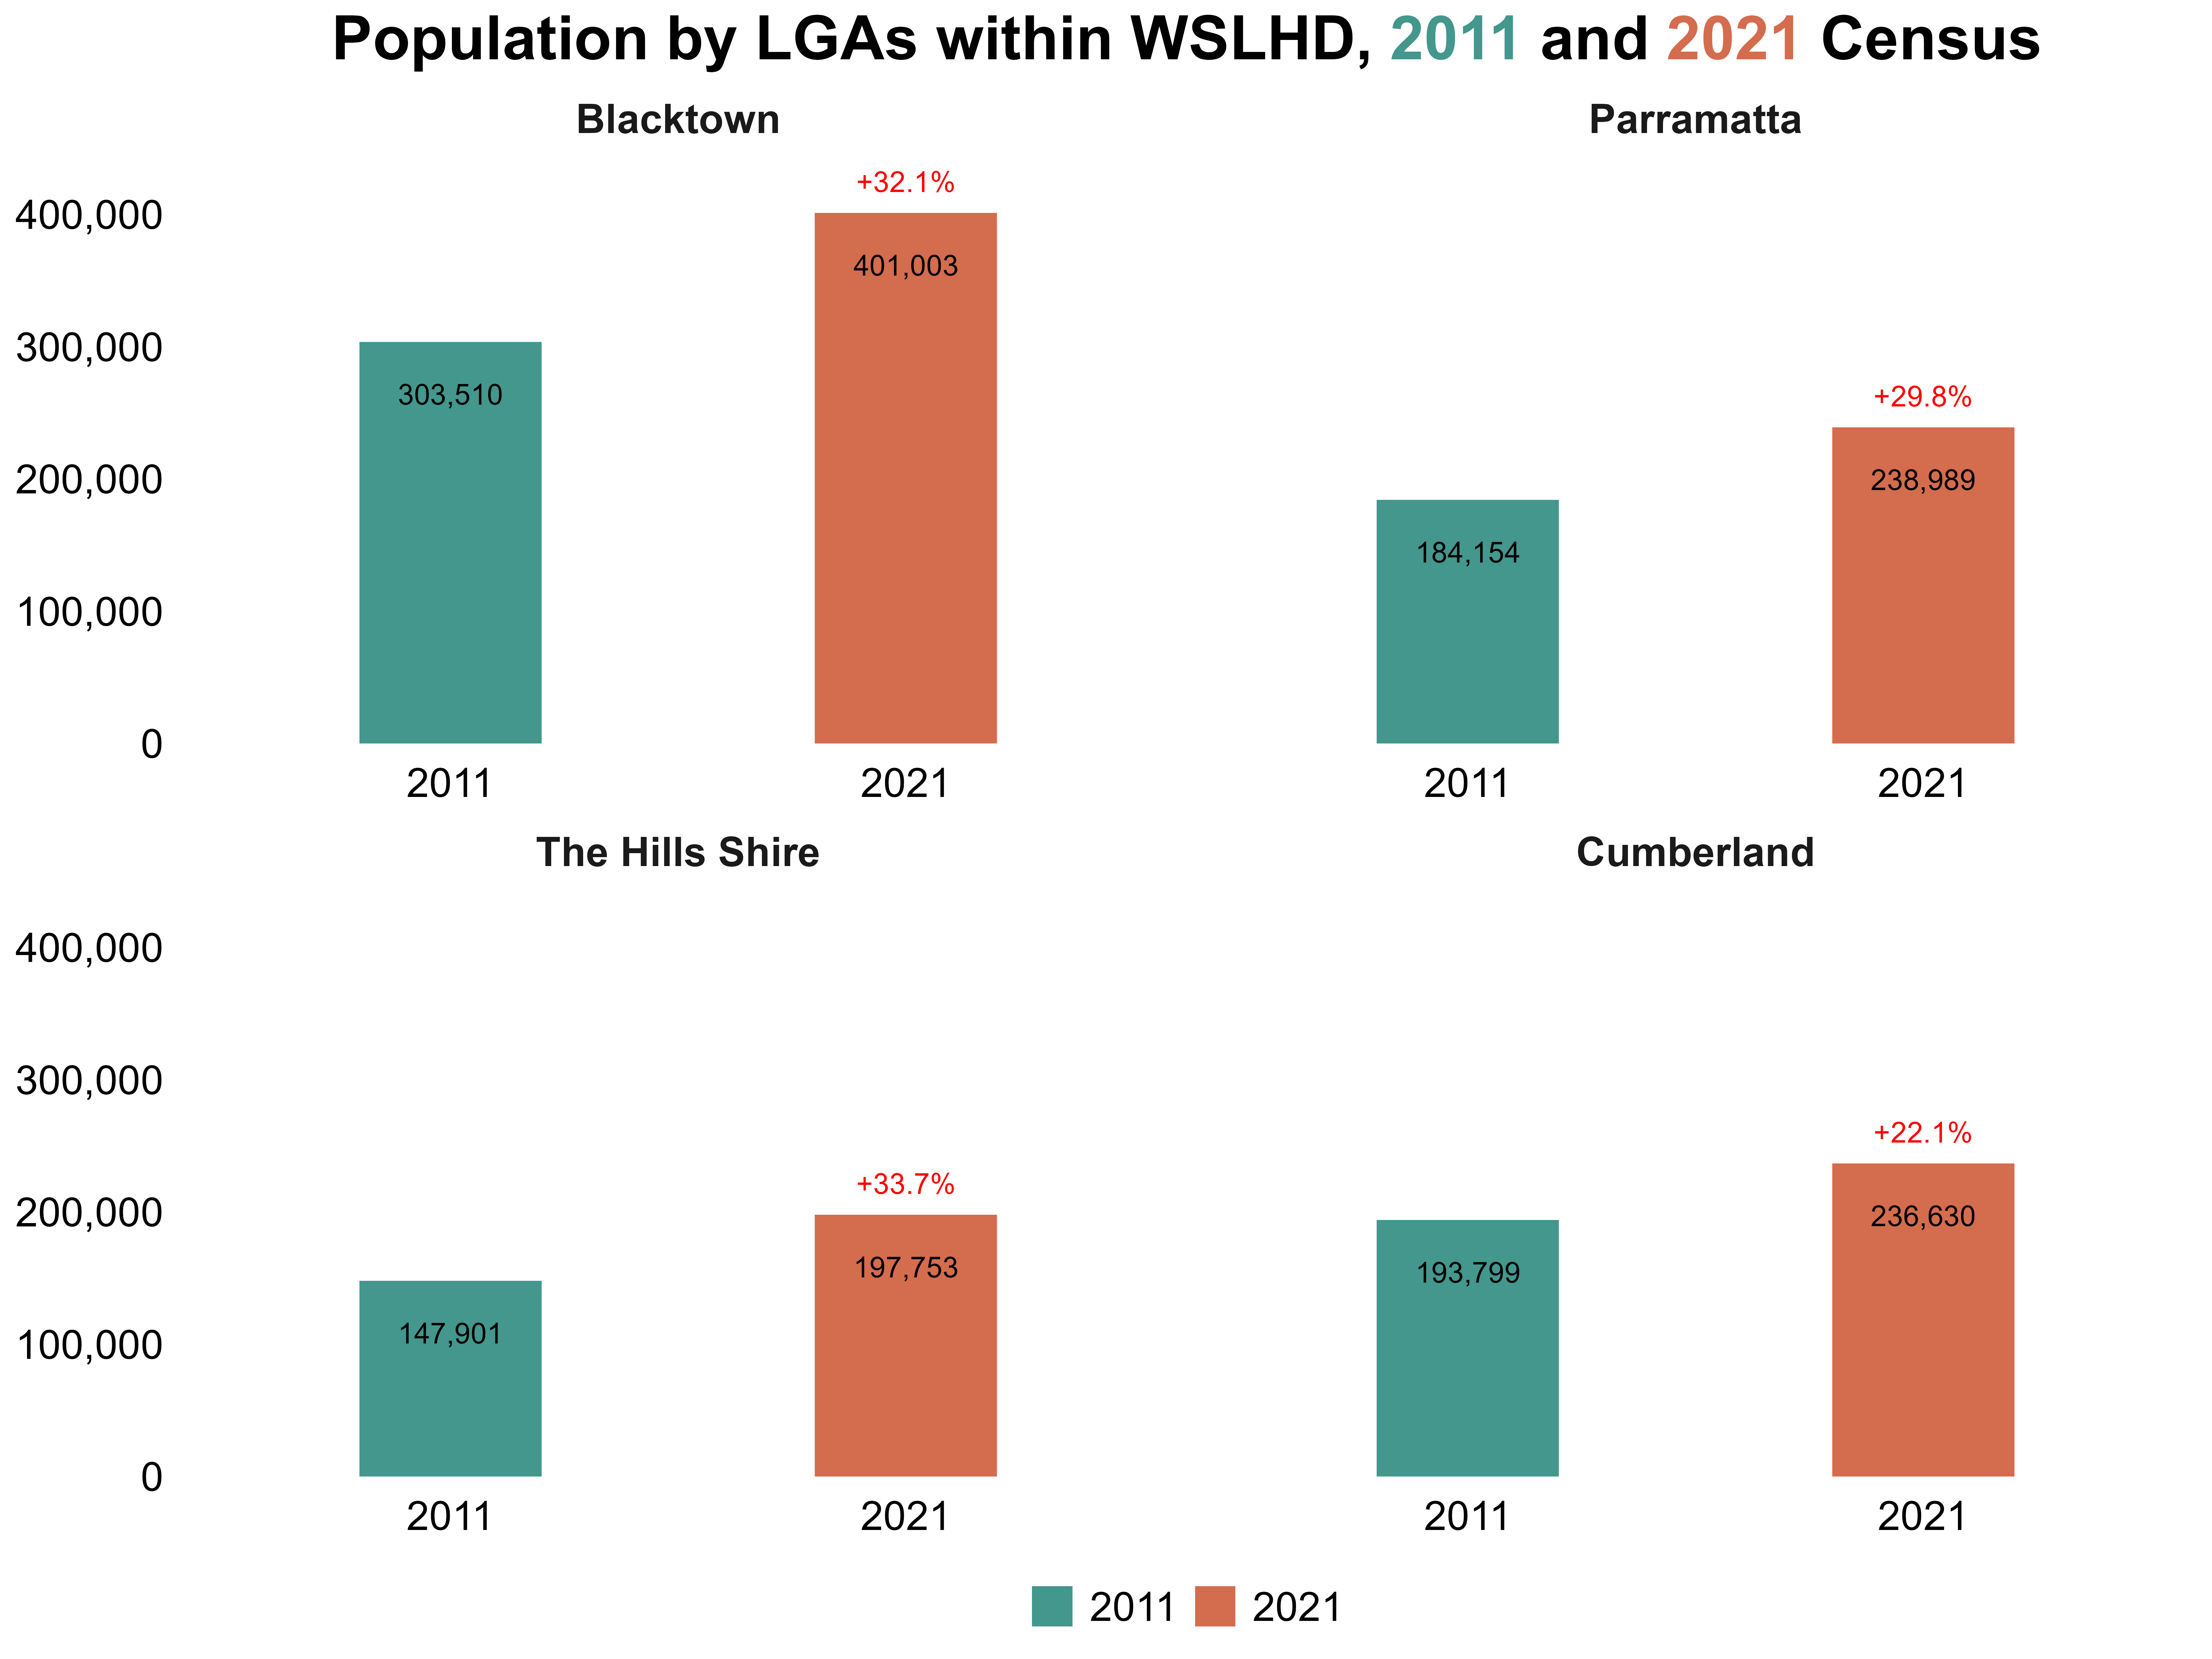
Blacktown is the largest LGA in WSLHD by population, and the fastest-growing one as well.
Between 2011 and 2021, its population jumped from over 300,000 to more than 400,000, marking an impressive growth rate of over 30%.
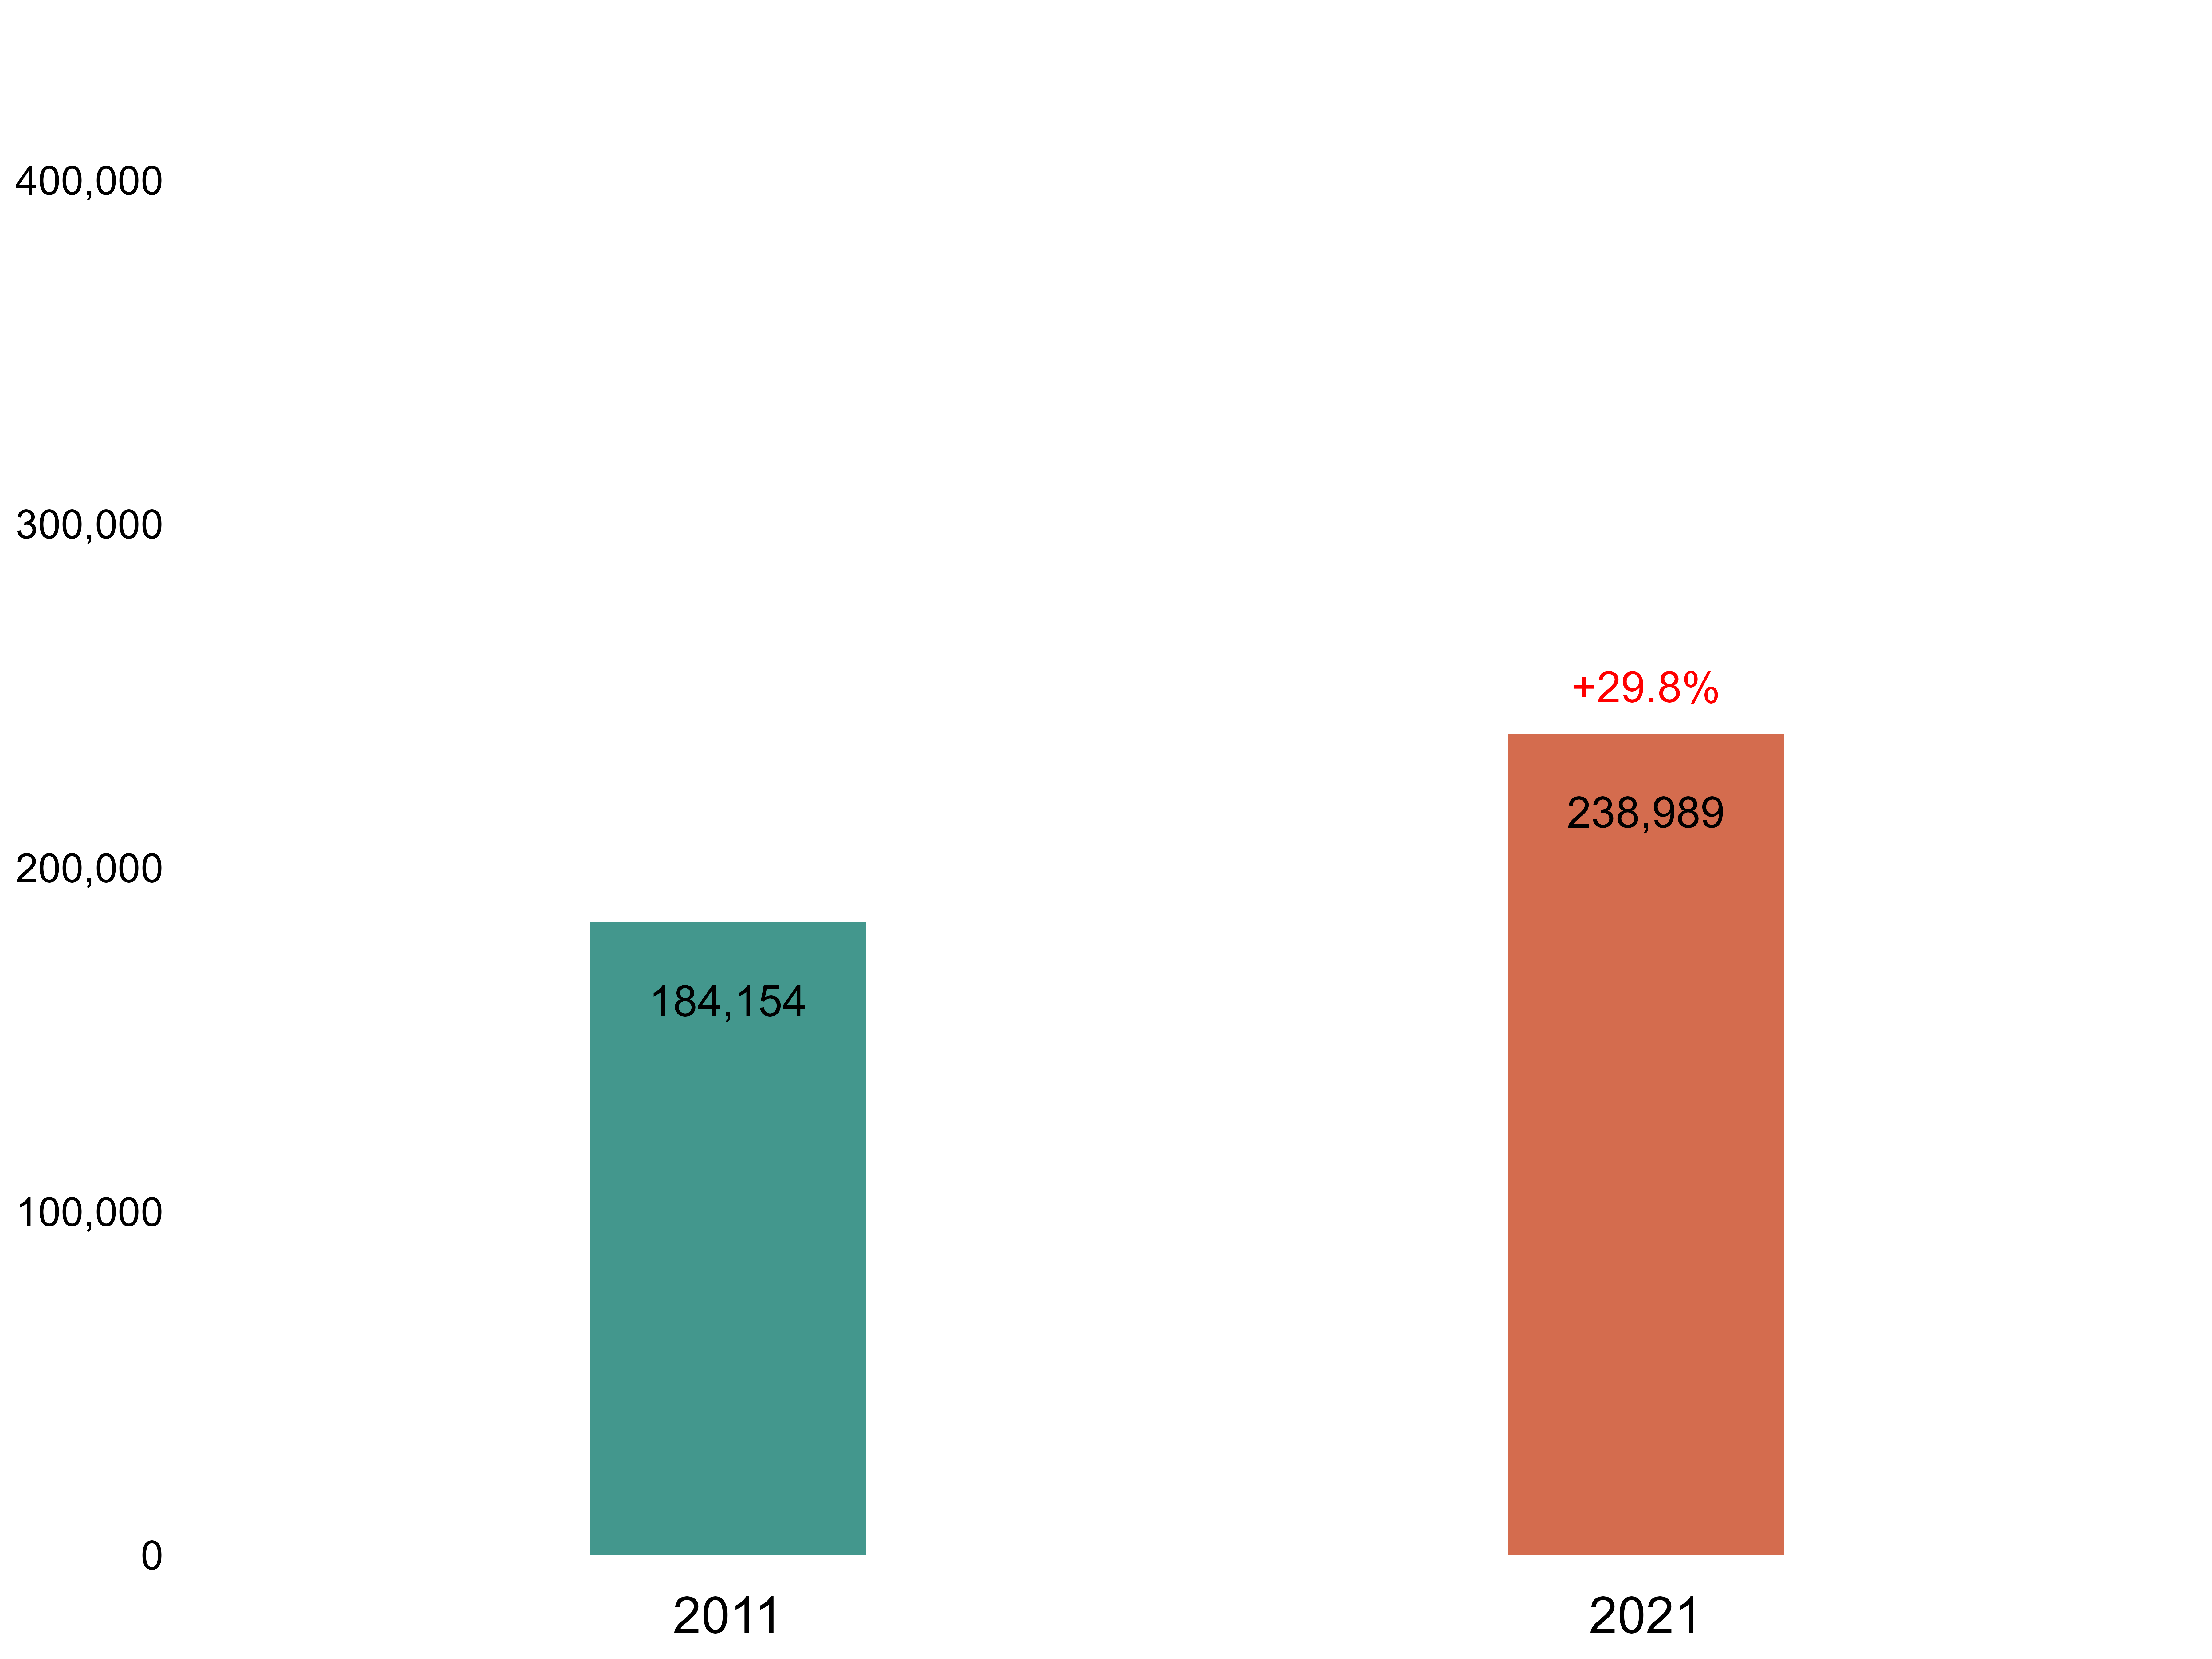
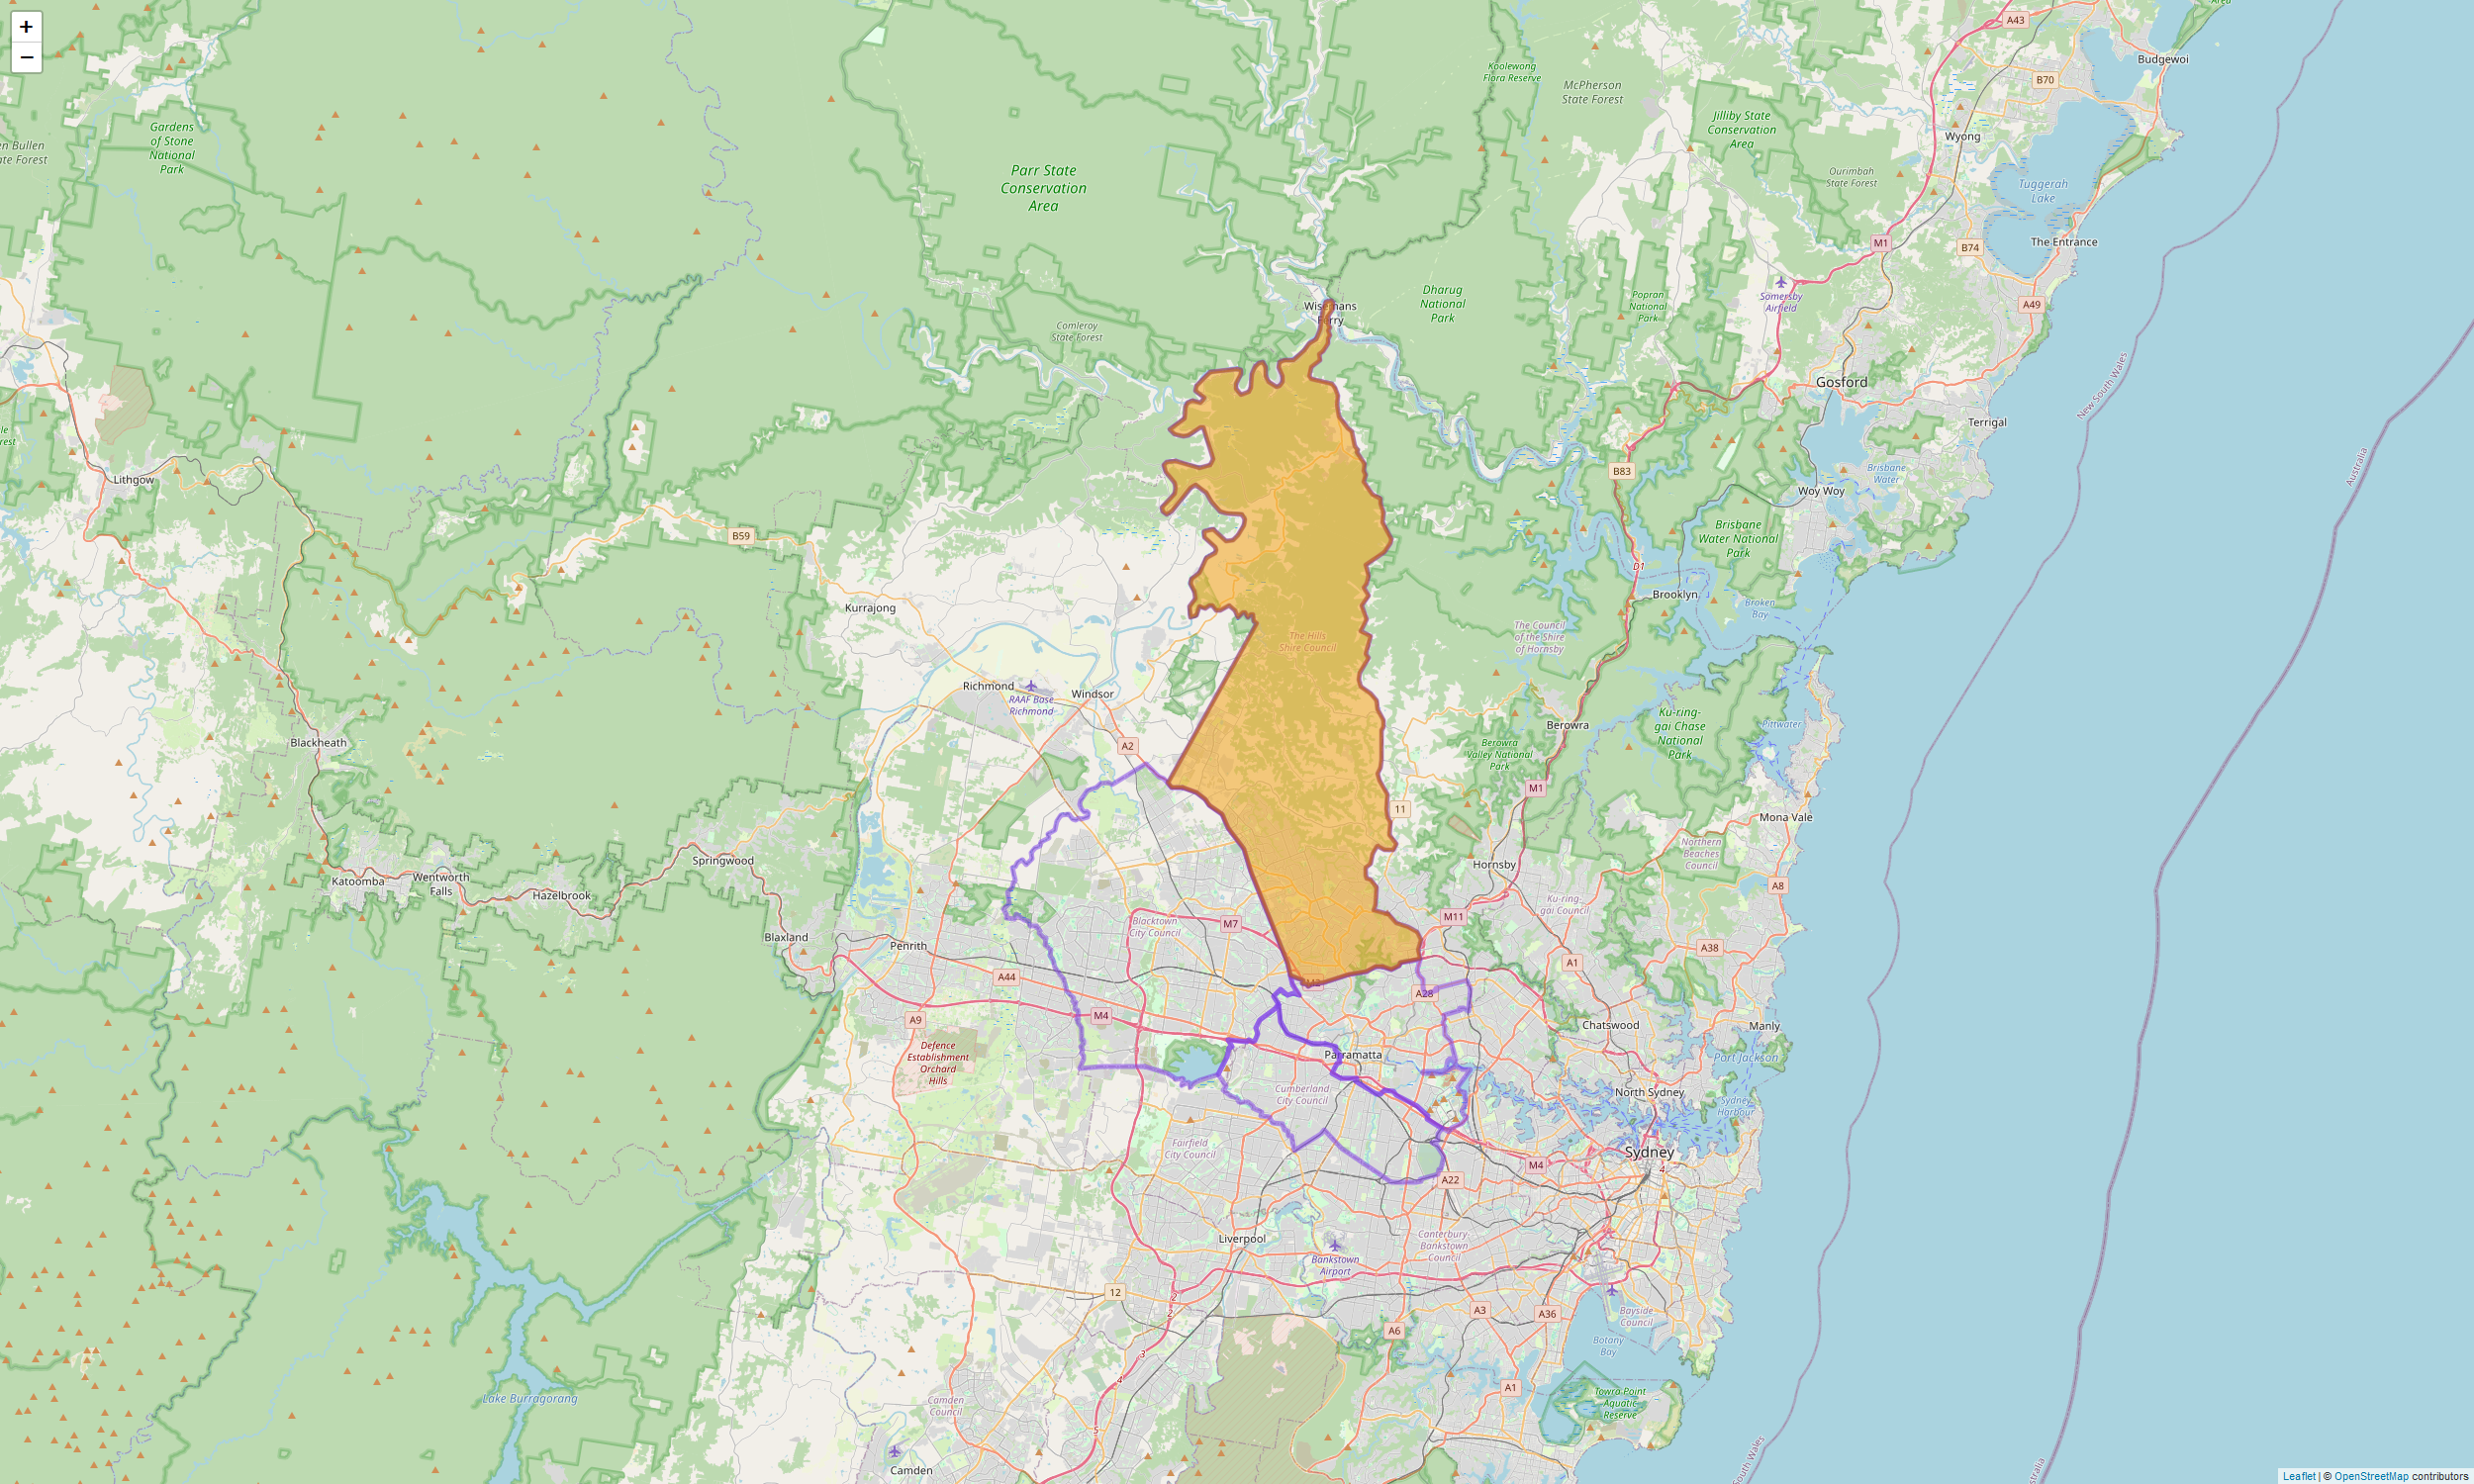
This is The Hills Shire.
The Hills Shire is the largest LGA in WSLHD by land size, and the one that grew the fastest between 2011 and 2021, with its population soaring by 33%.
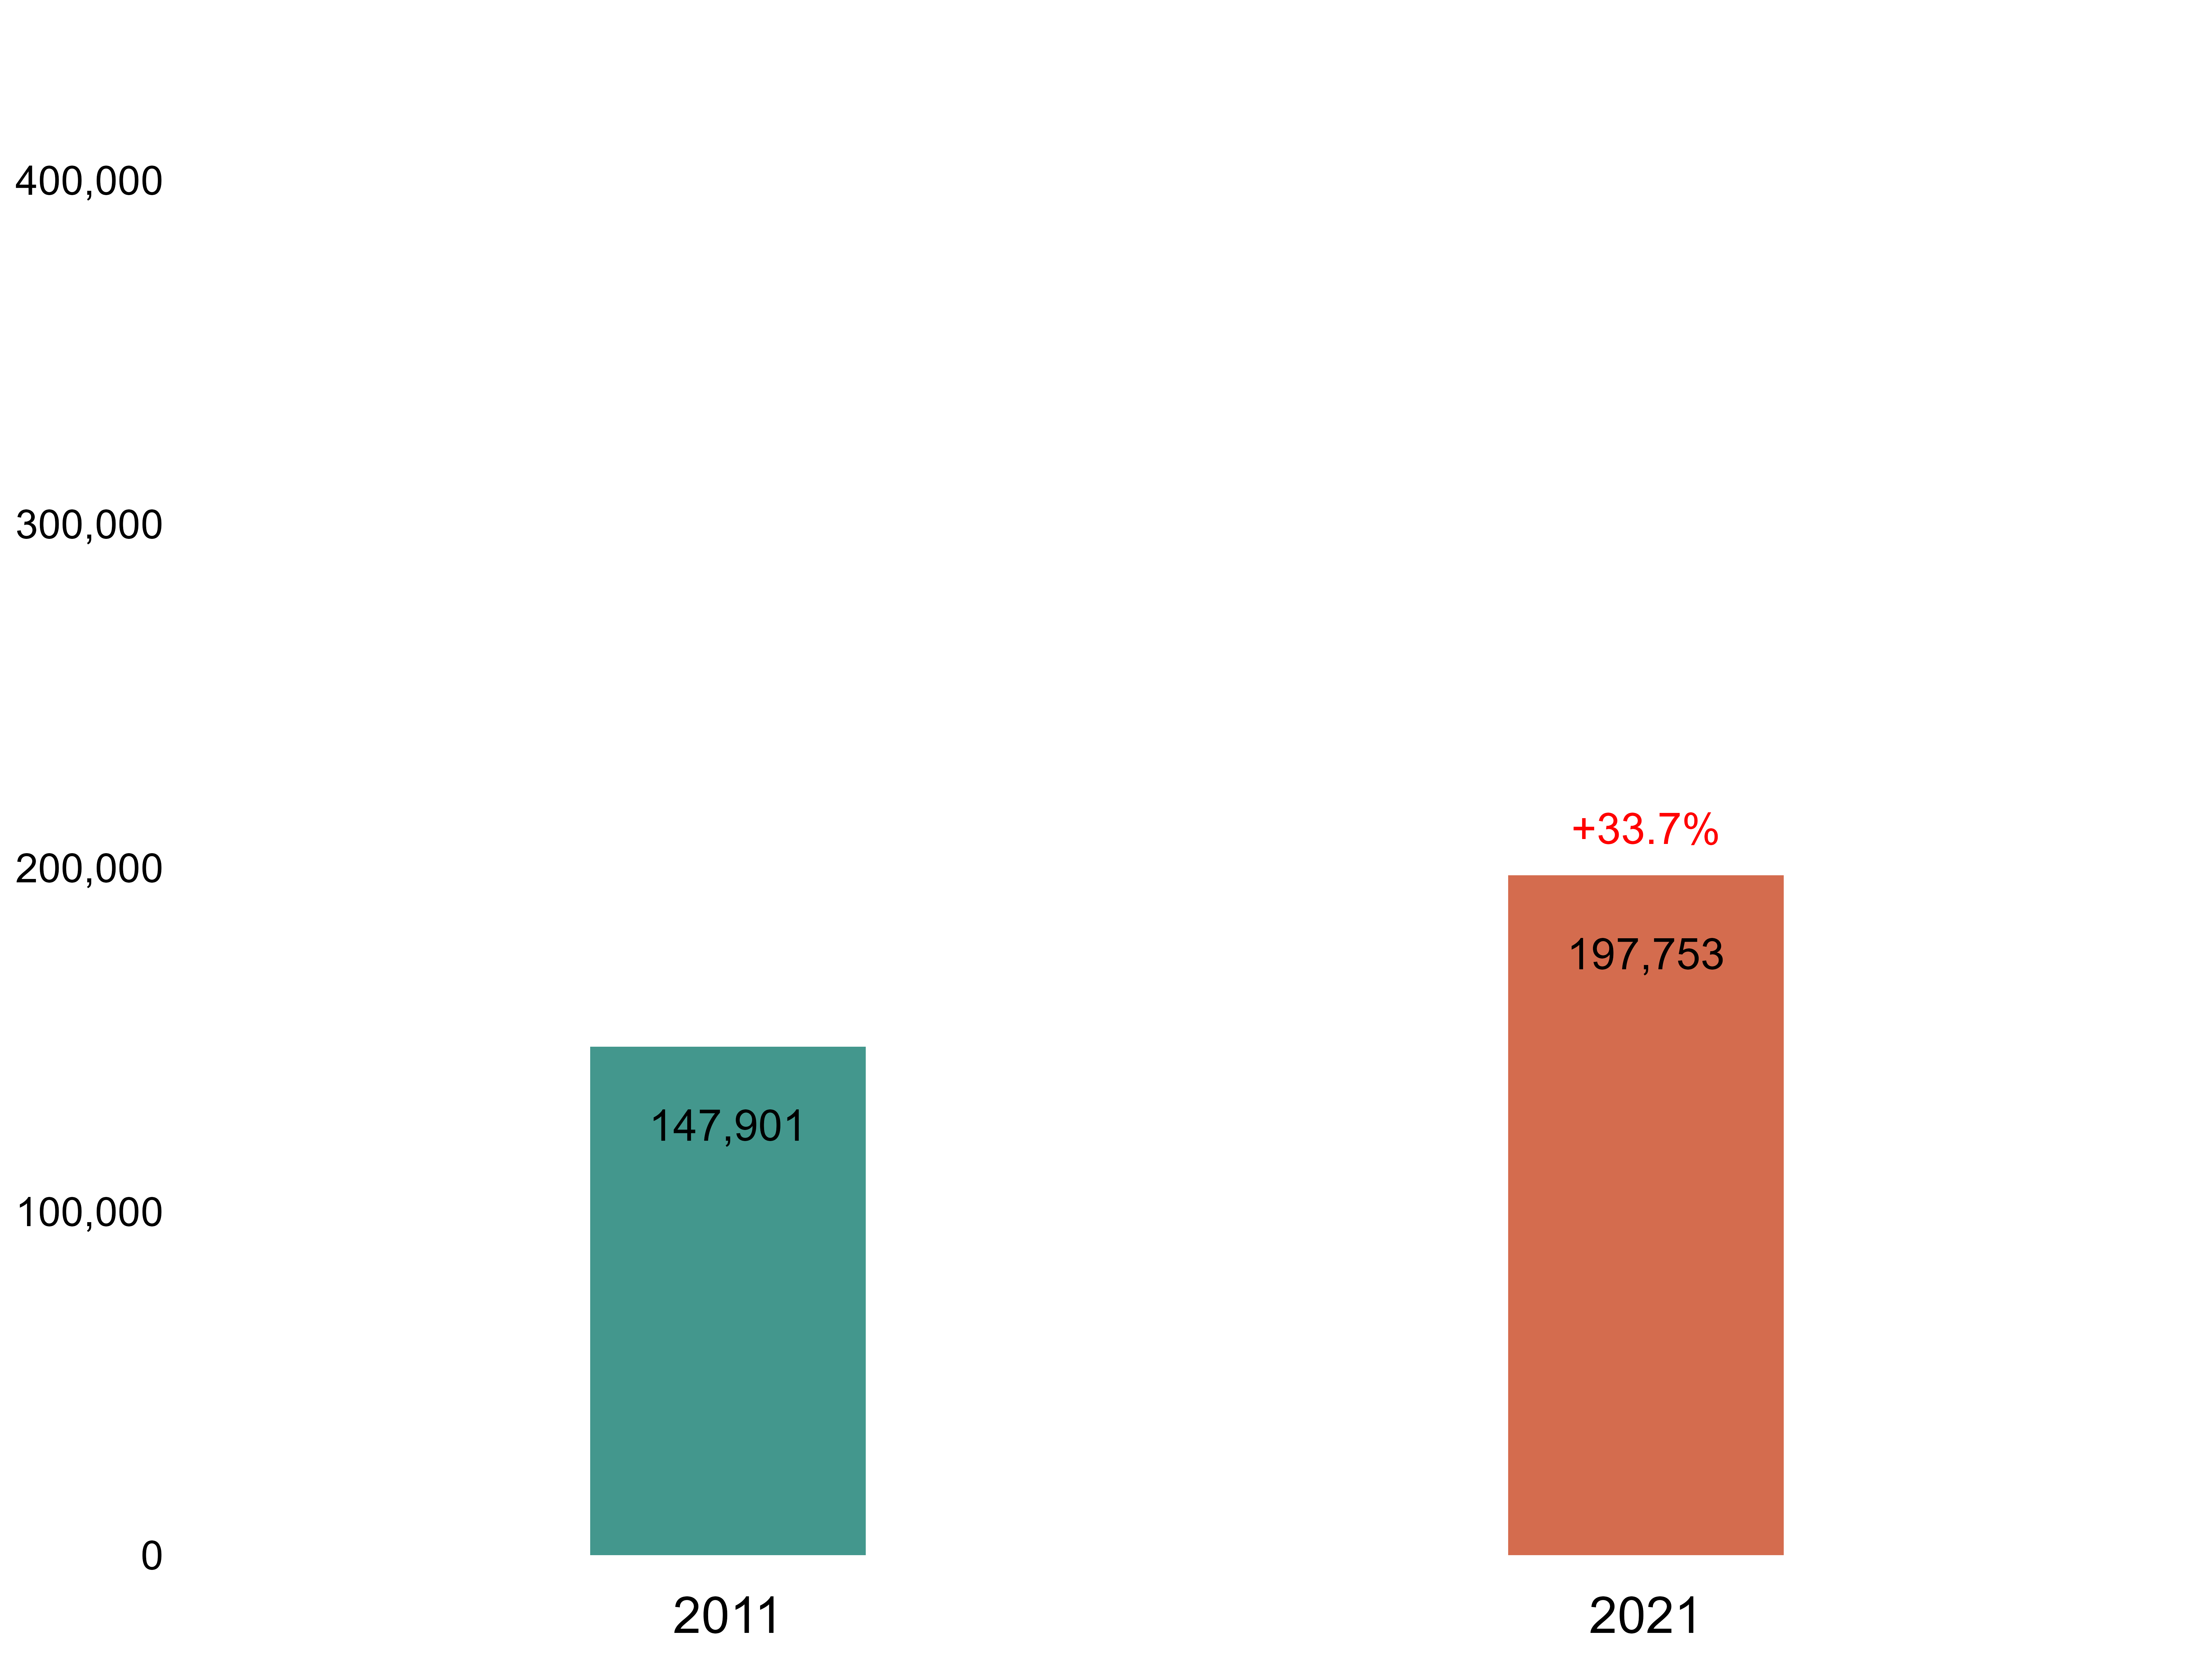
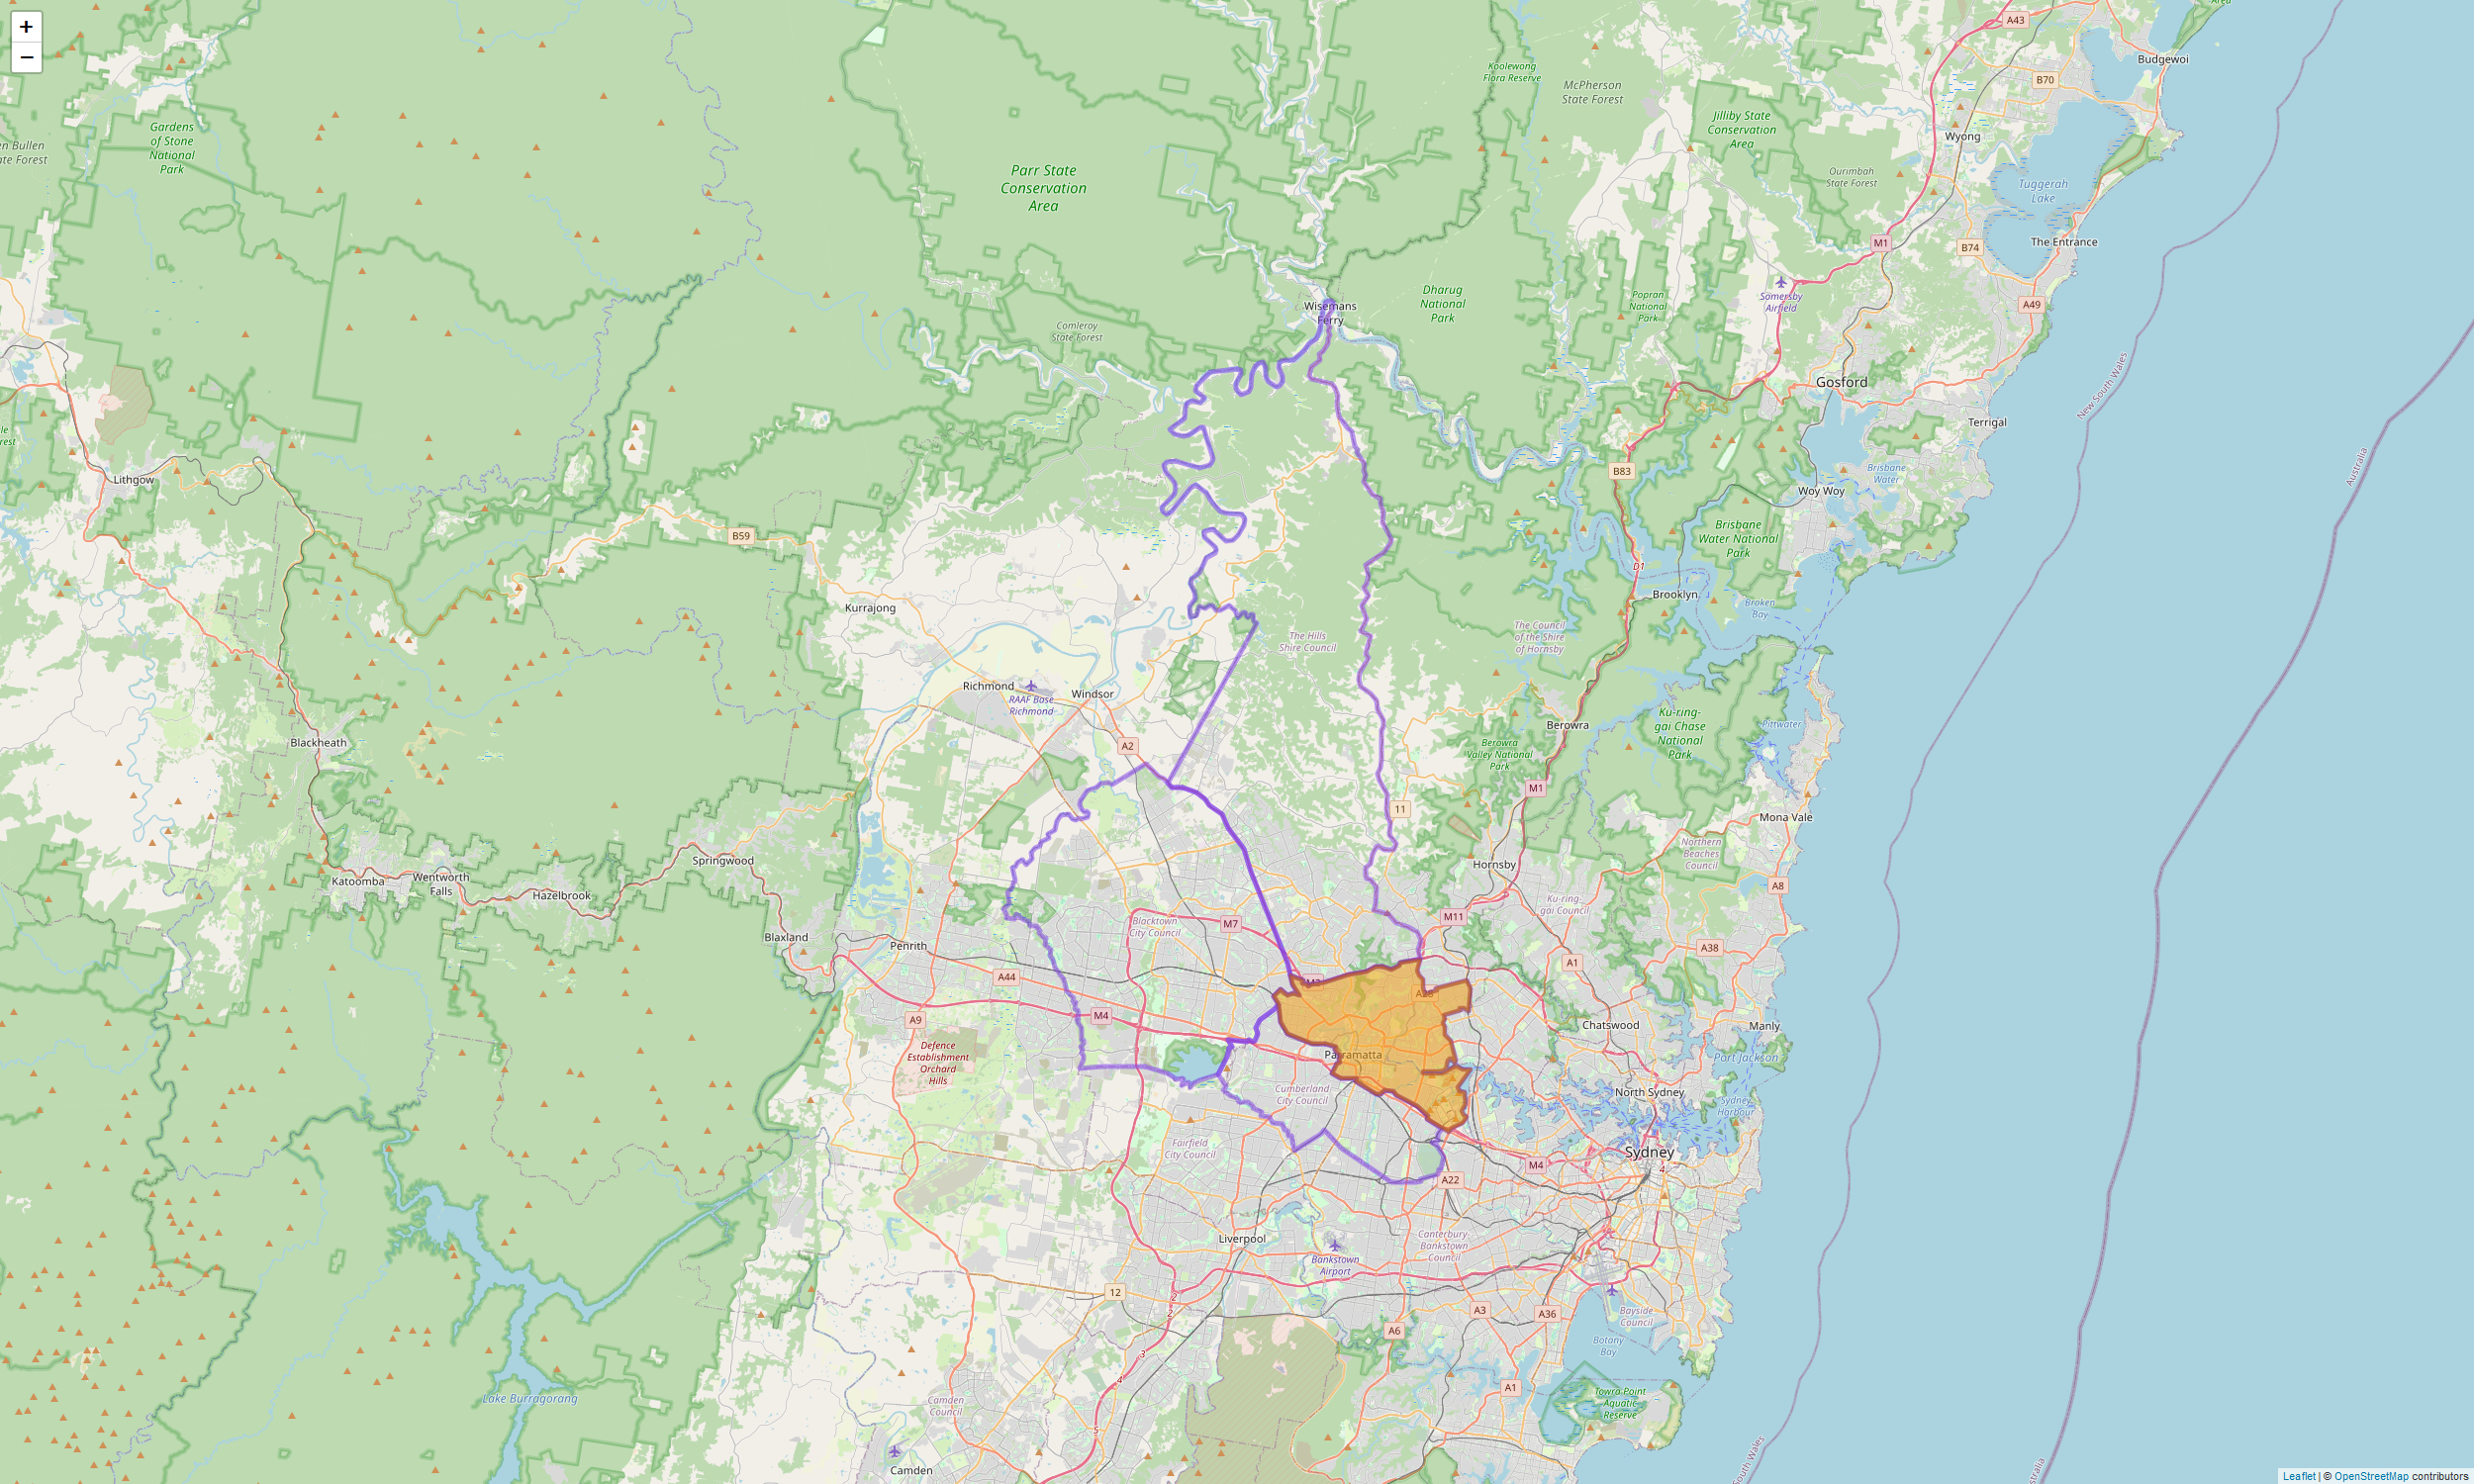
This is Parramatta.
Parramatta is the CBD of Western Sydney and the second largest LGA in WSLHD by population.
Between 2011 and 2021, it rose from the third to the second most populous LGA in WSLHD, with its population surpassing 200,000.
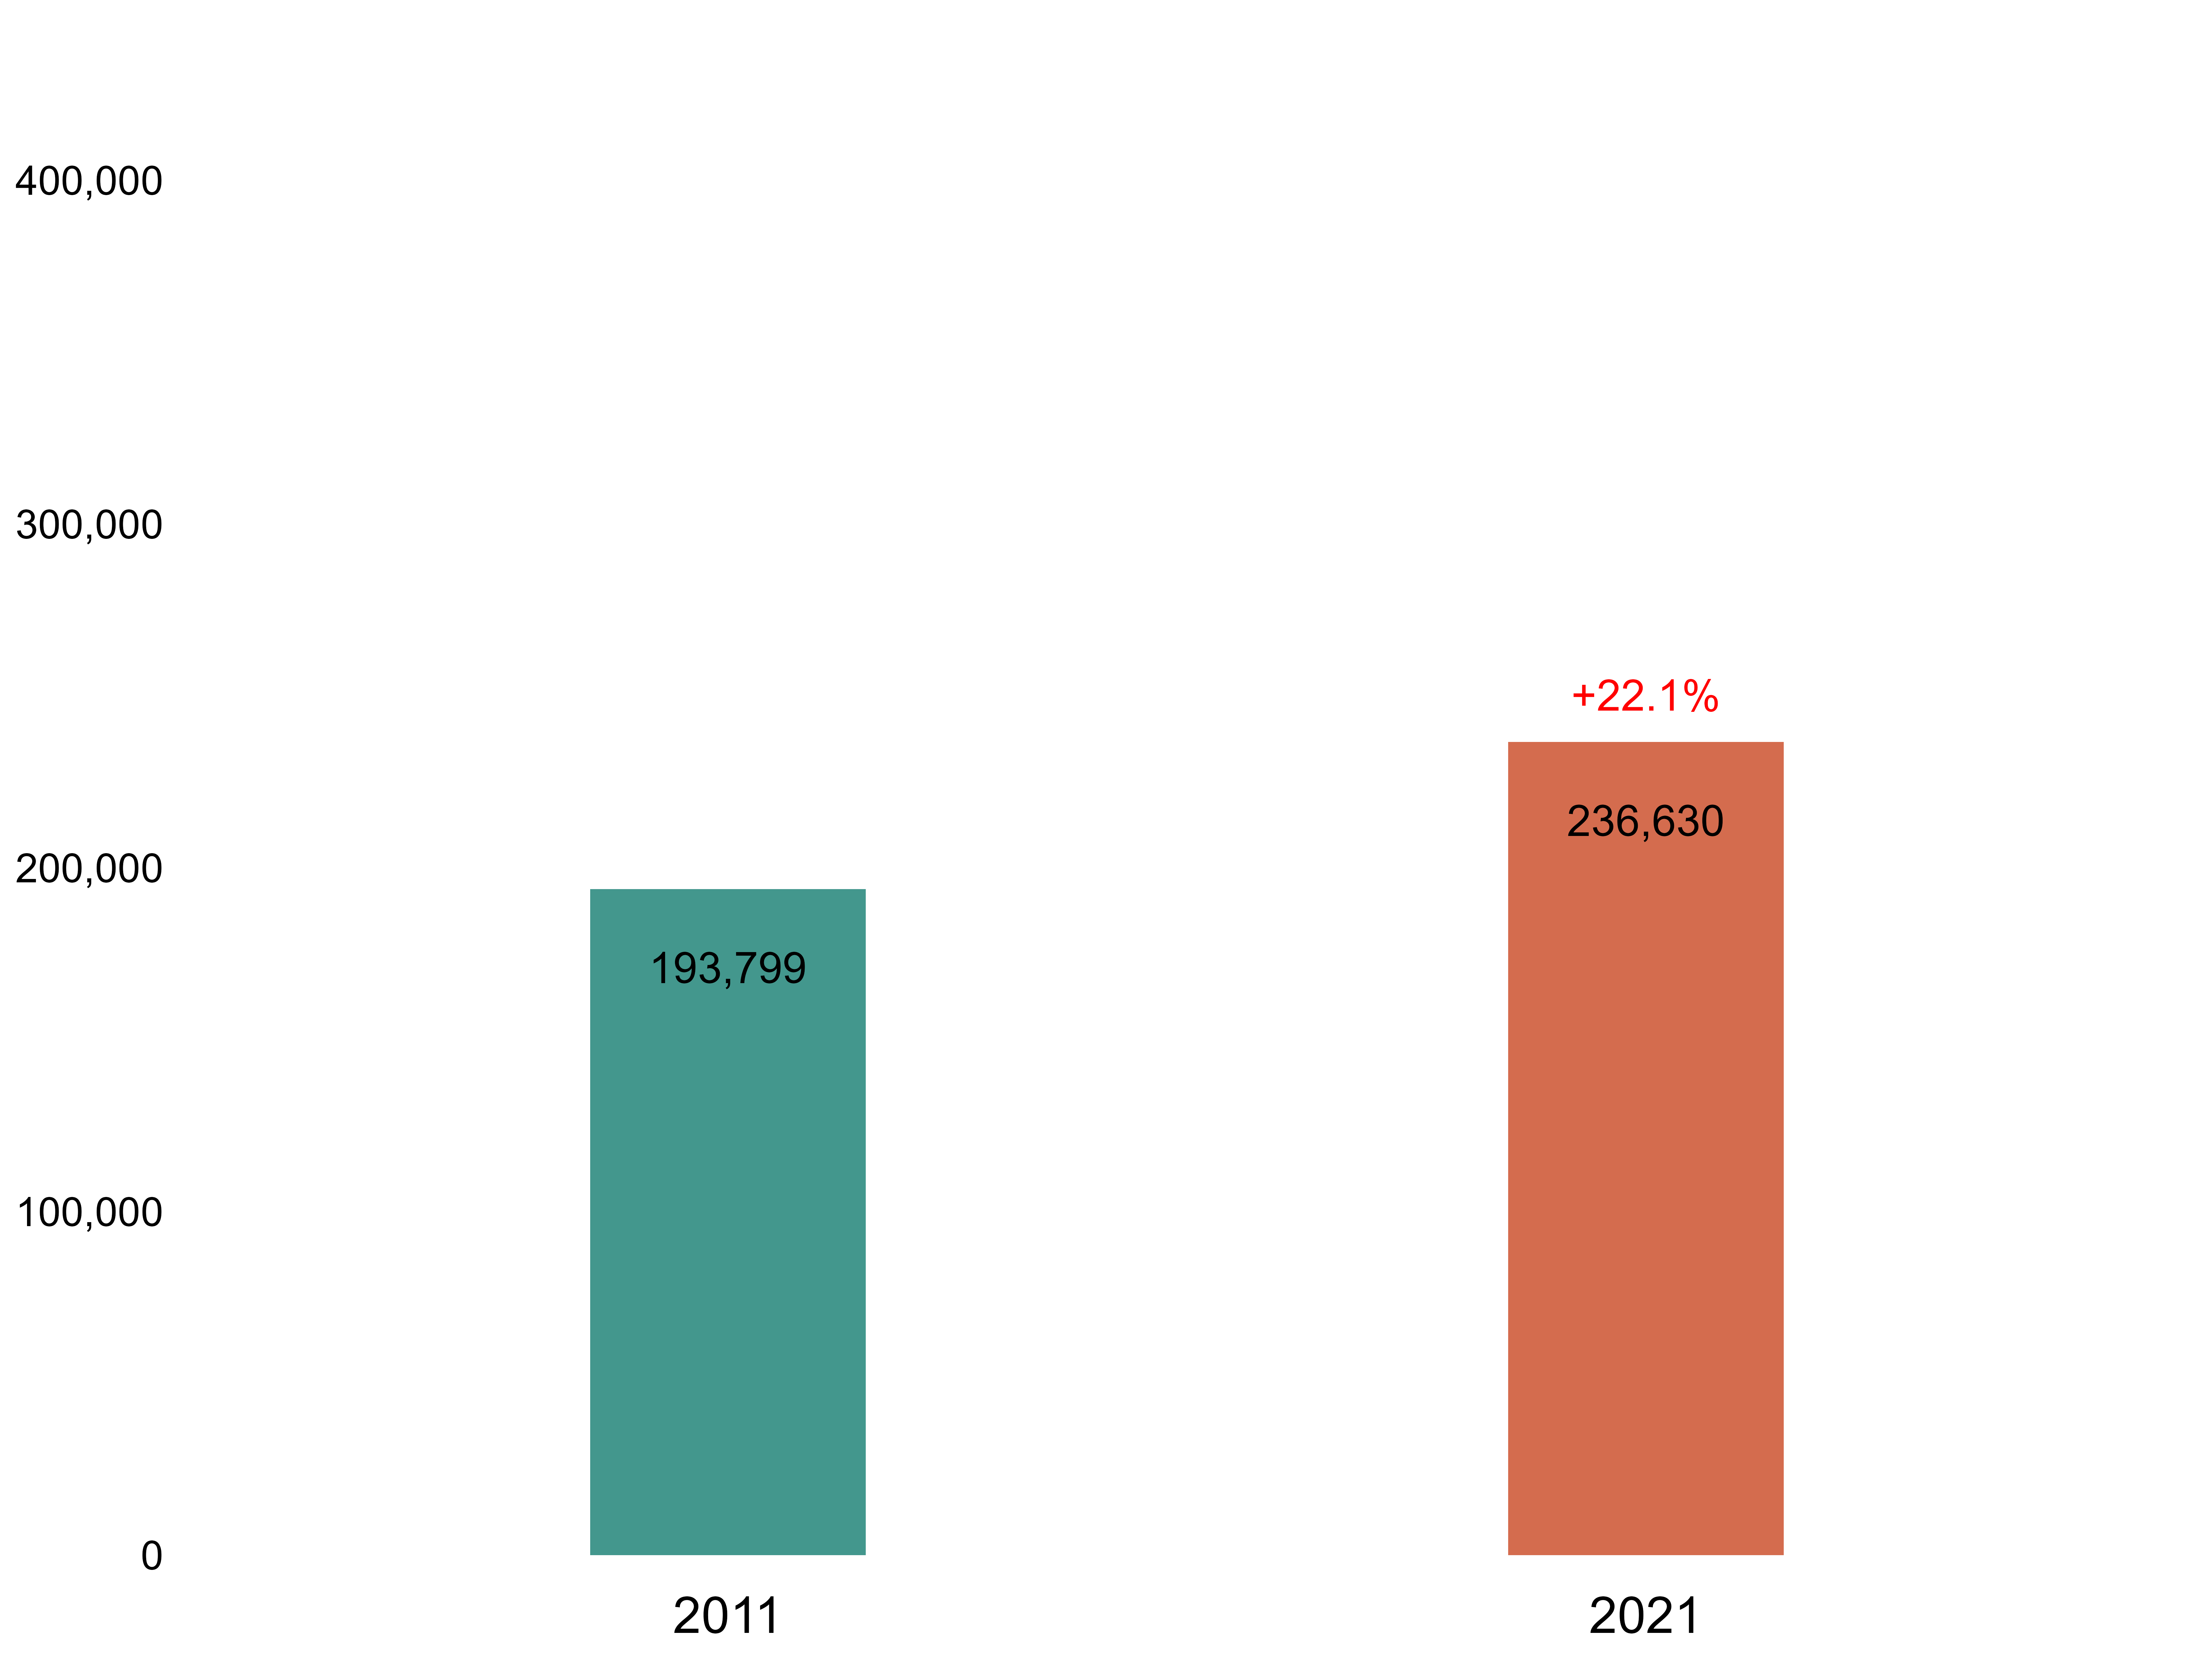
This is Cumberland.
This area was formerly governed by Holroyd before being renamed in 2016, when the NSW Local Government amalgamations created the Cumberland Council in May.
Between 2011 and 2021, its population grew steadily, surpassing the 200,000.
Let’s explore how the populations of the four LGAs have grown between 2011 and 2021.
We now integrate the population bar charts of the four LGAs for a comparative view.
But that’s not enough…
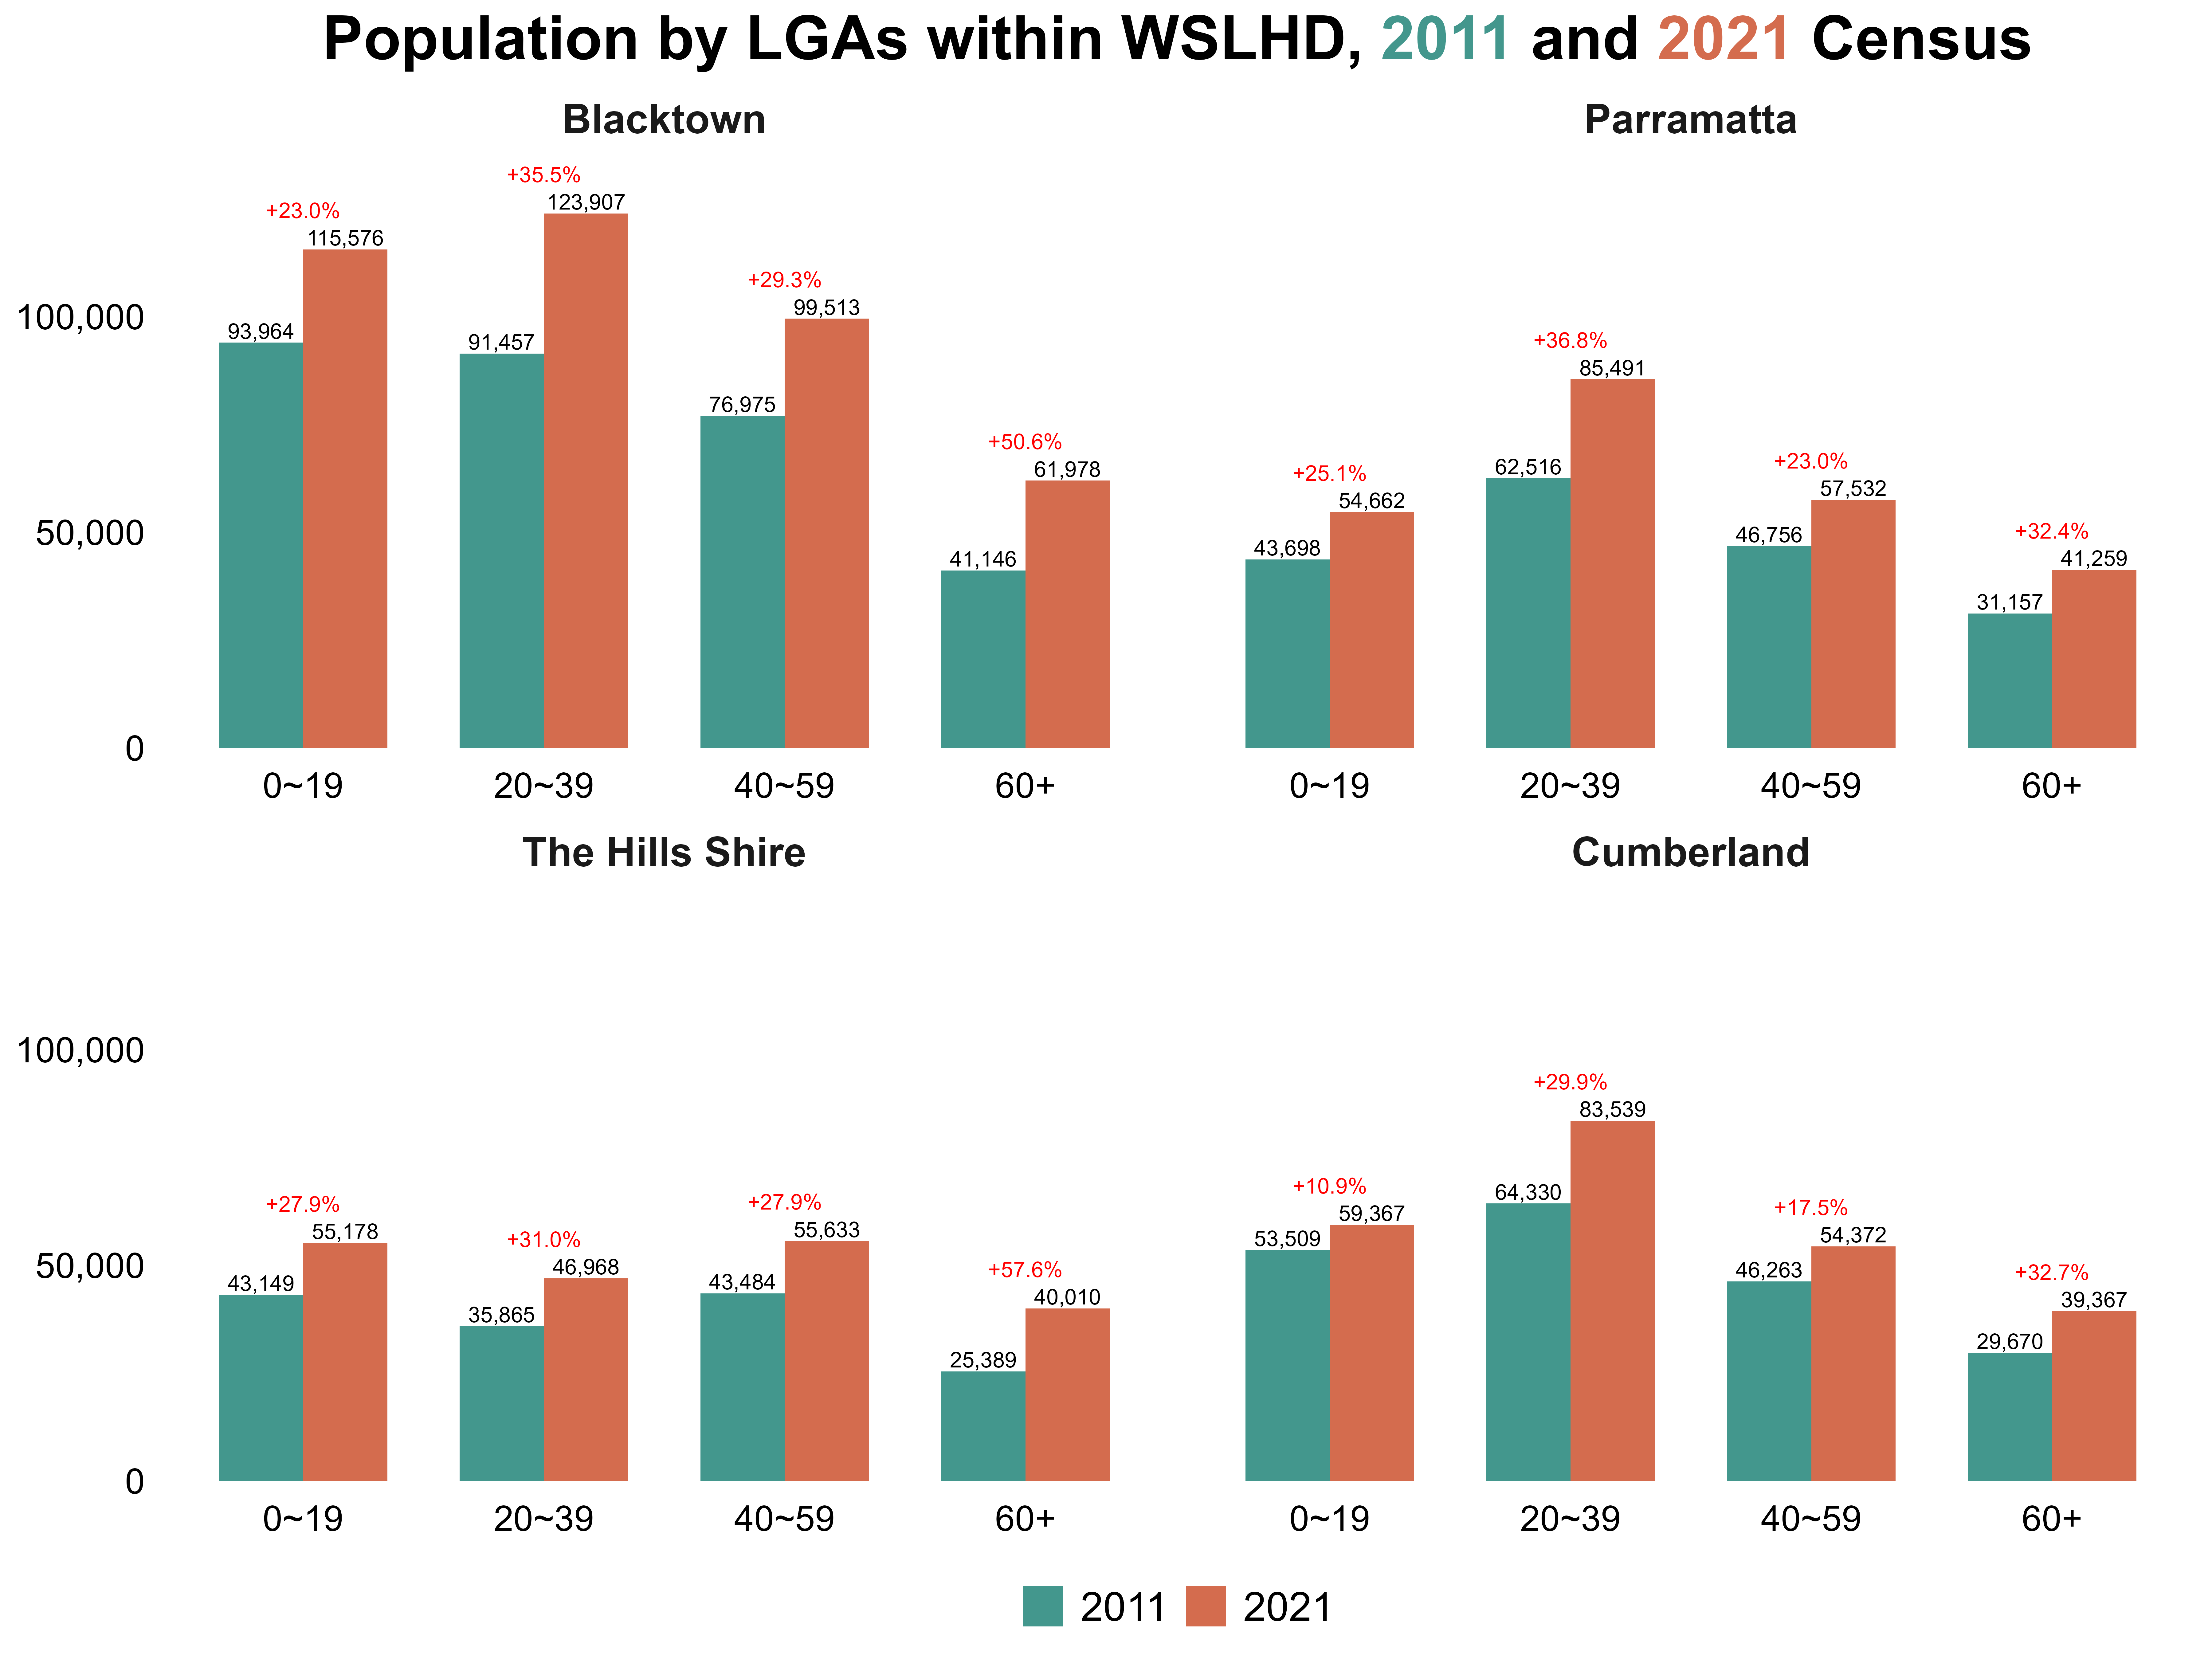
If we break the population down into four age groups, an interesting pattern begins to emerge.
Across all four LGAs, young adults grew by about 30%, reaching more than 350,000 people in total.
What we see is a surge of young adults flowing into Western Sydney, becoming the driving force of the region’s population. This trend reflects WSLHD status as an economic hub.
Alongside the growth of the young workforce, there has also been a significant increase in the number of children and teenagers.
This suggests that the young generation represents a dominant profile in Western Sydney.
But there’s another striking pattern…
In just ten years, the 60+ population grew by over 40% in total, the highest increase of all age groups.
In Blacktown and The Hills Shire, the growth rate even topped 50%, highlighting the significant healthcare challenges that an ageing population already presents for WSLHD.
WSLHD is a vibrant and culturally diverse district, enriched by communities that speak different languages and represent cultures from around the world.
Let’s now explore the cultural diversity within WSLHD.

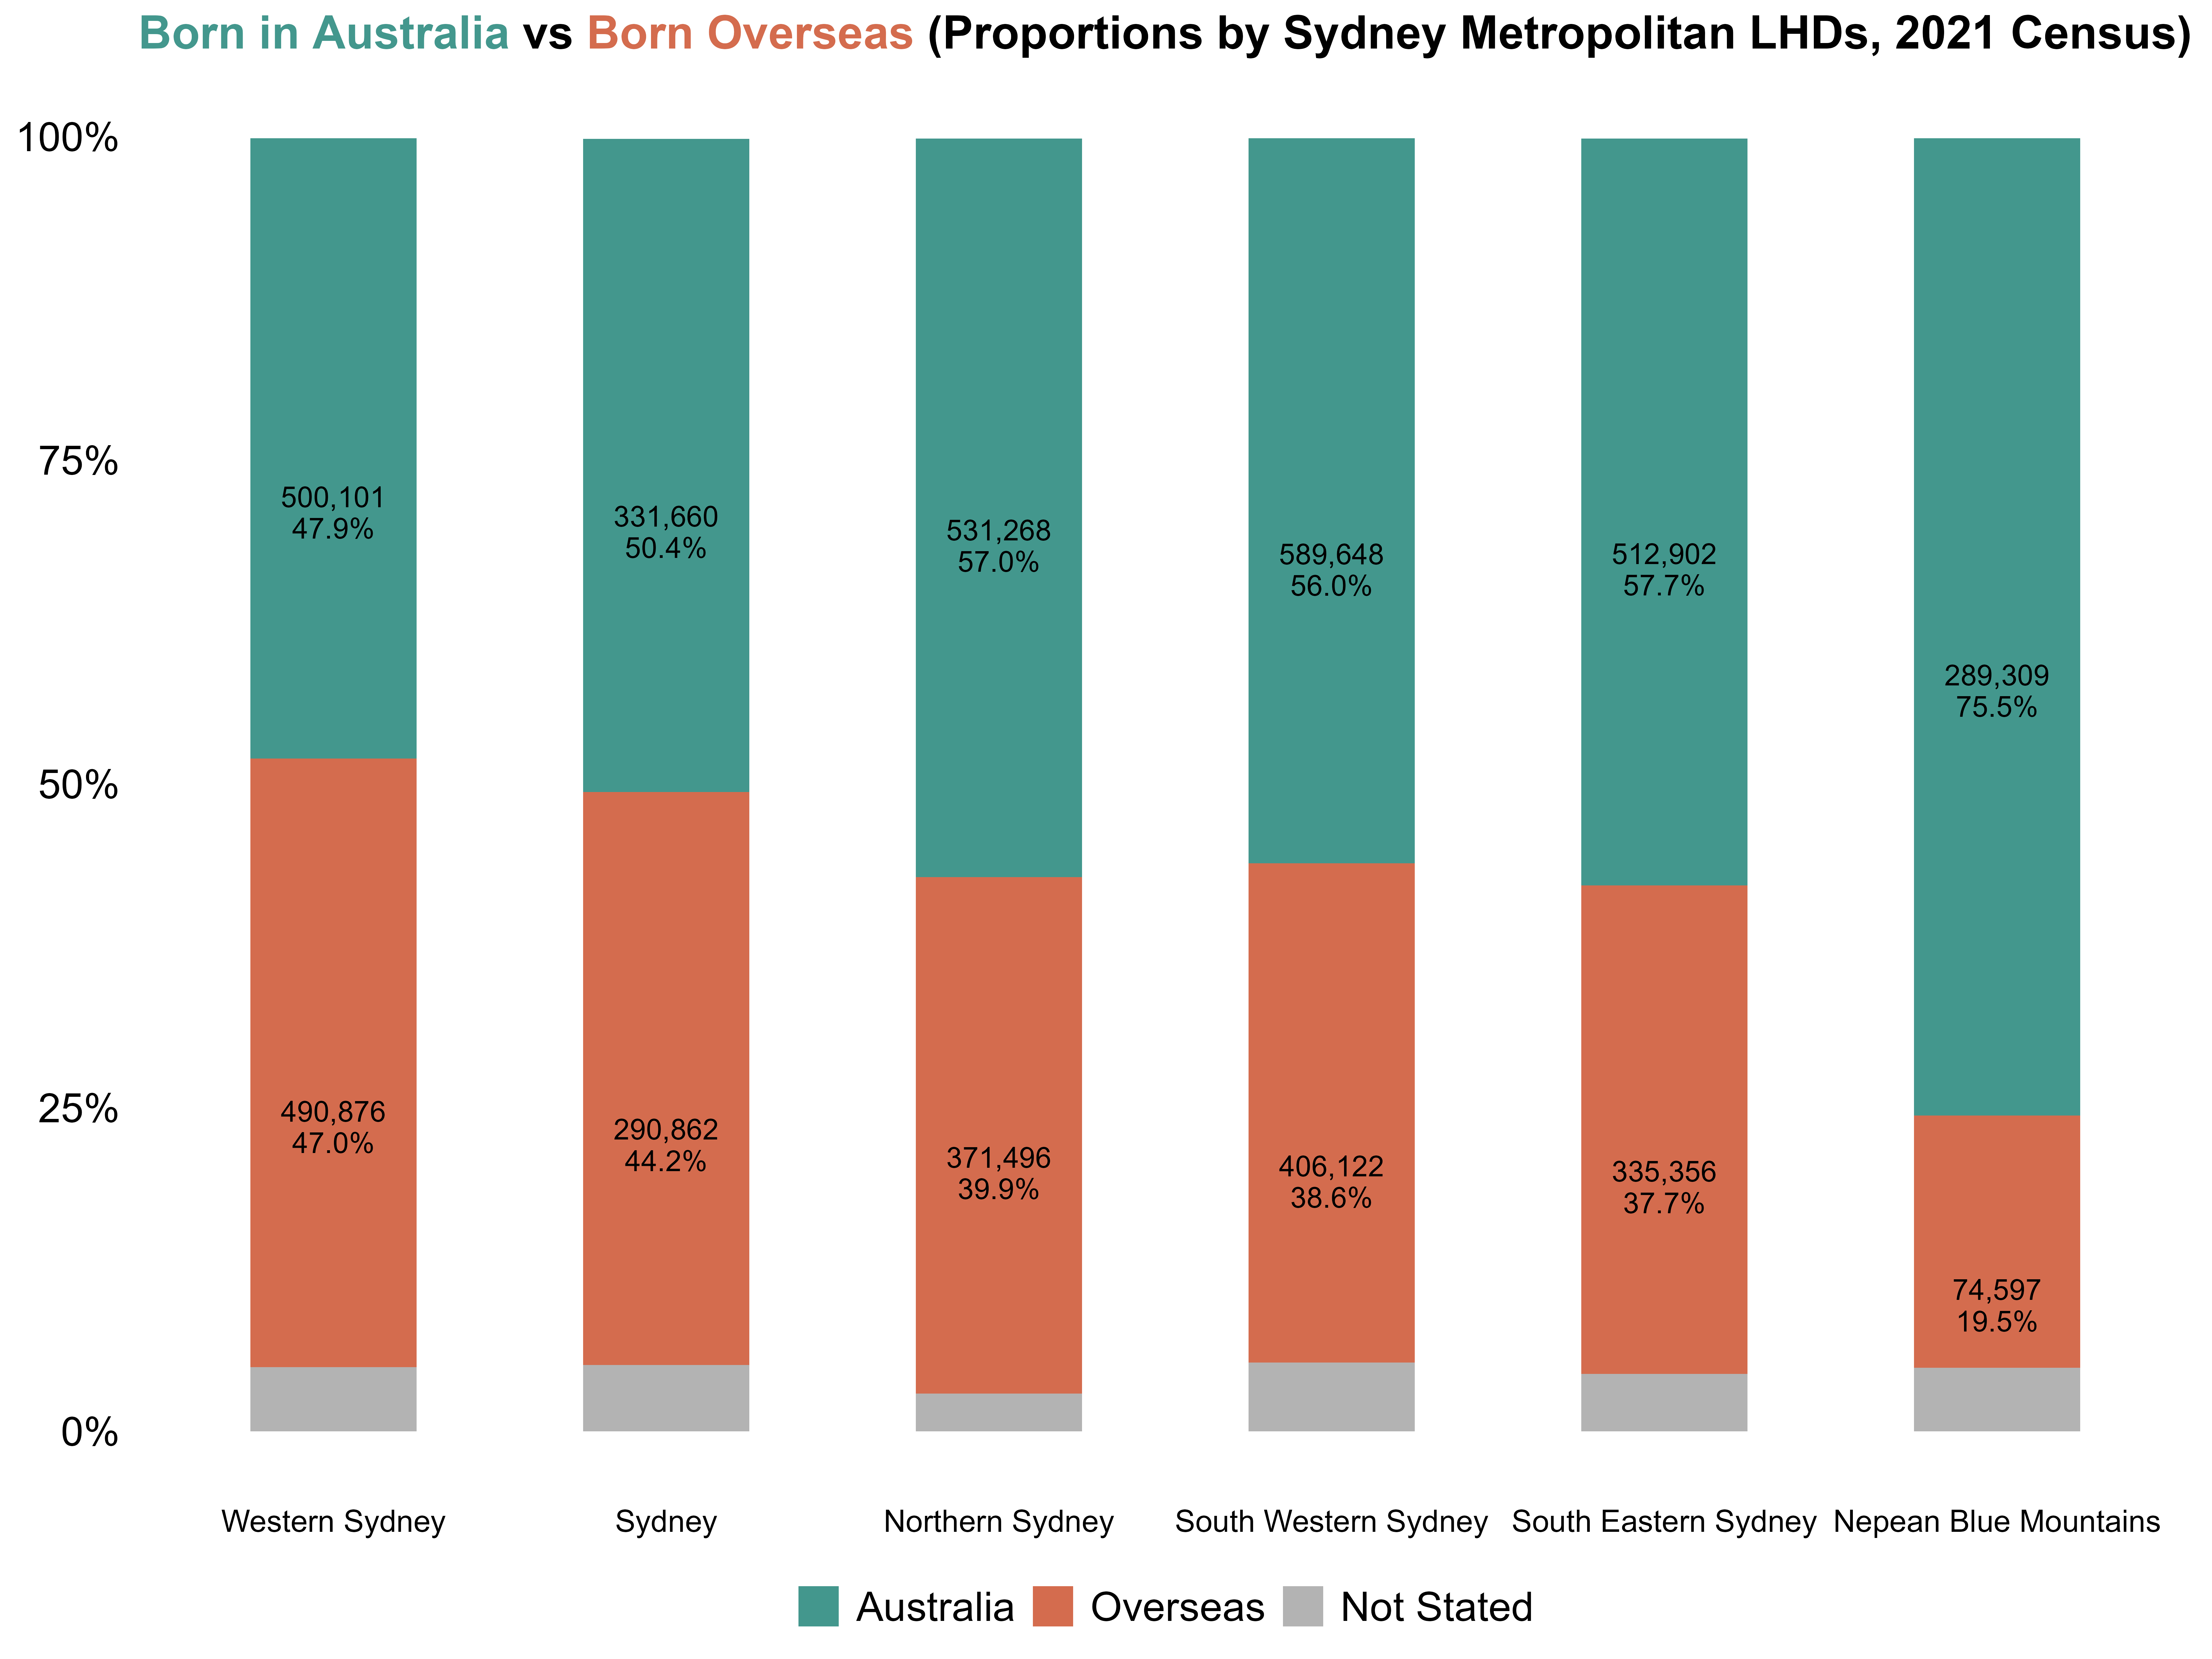
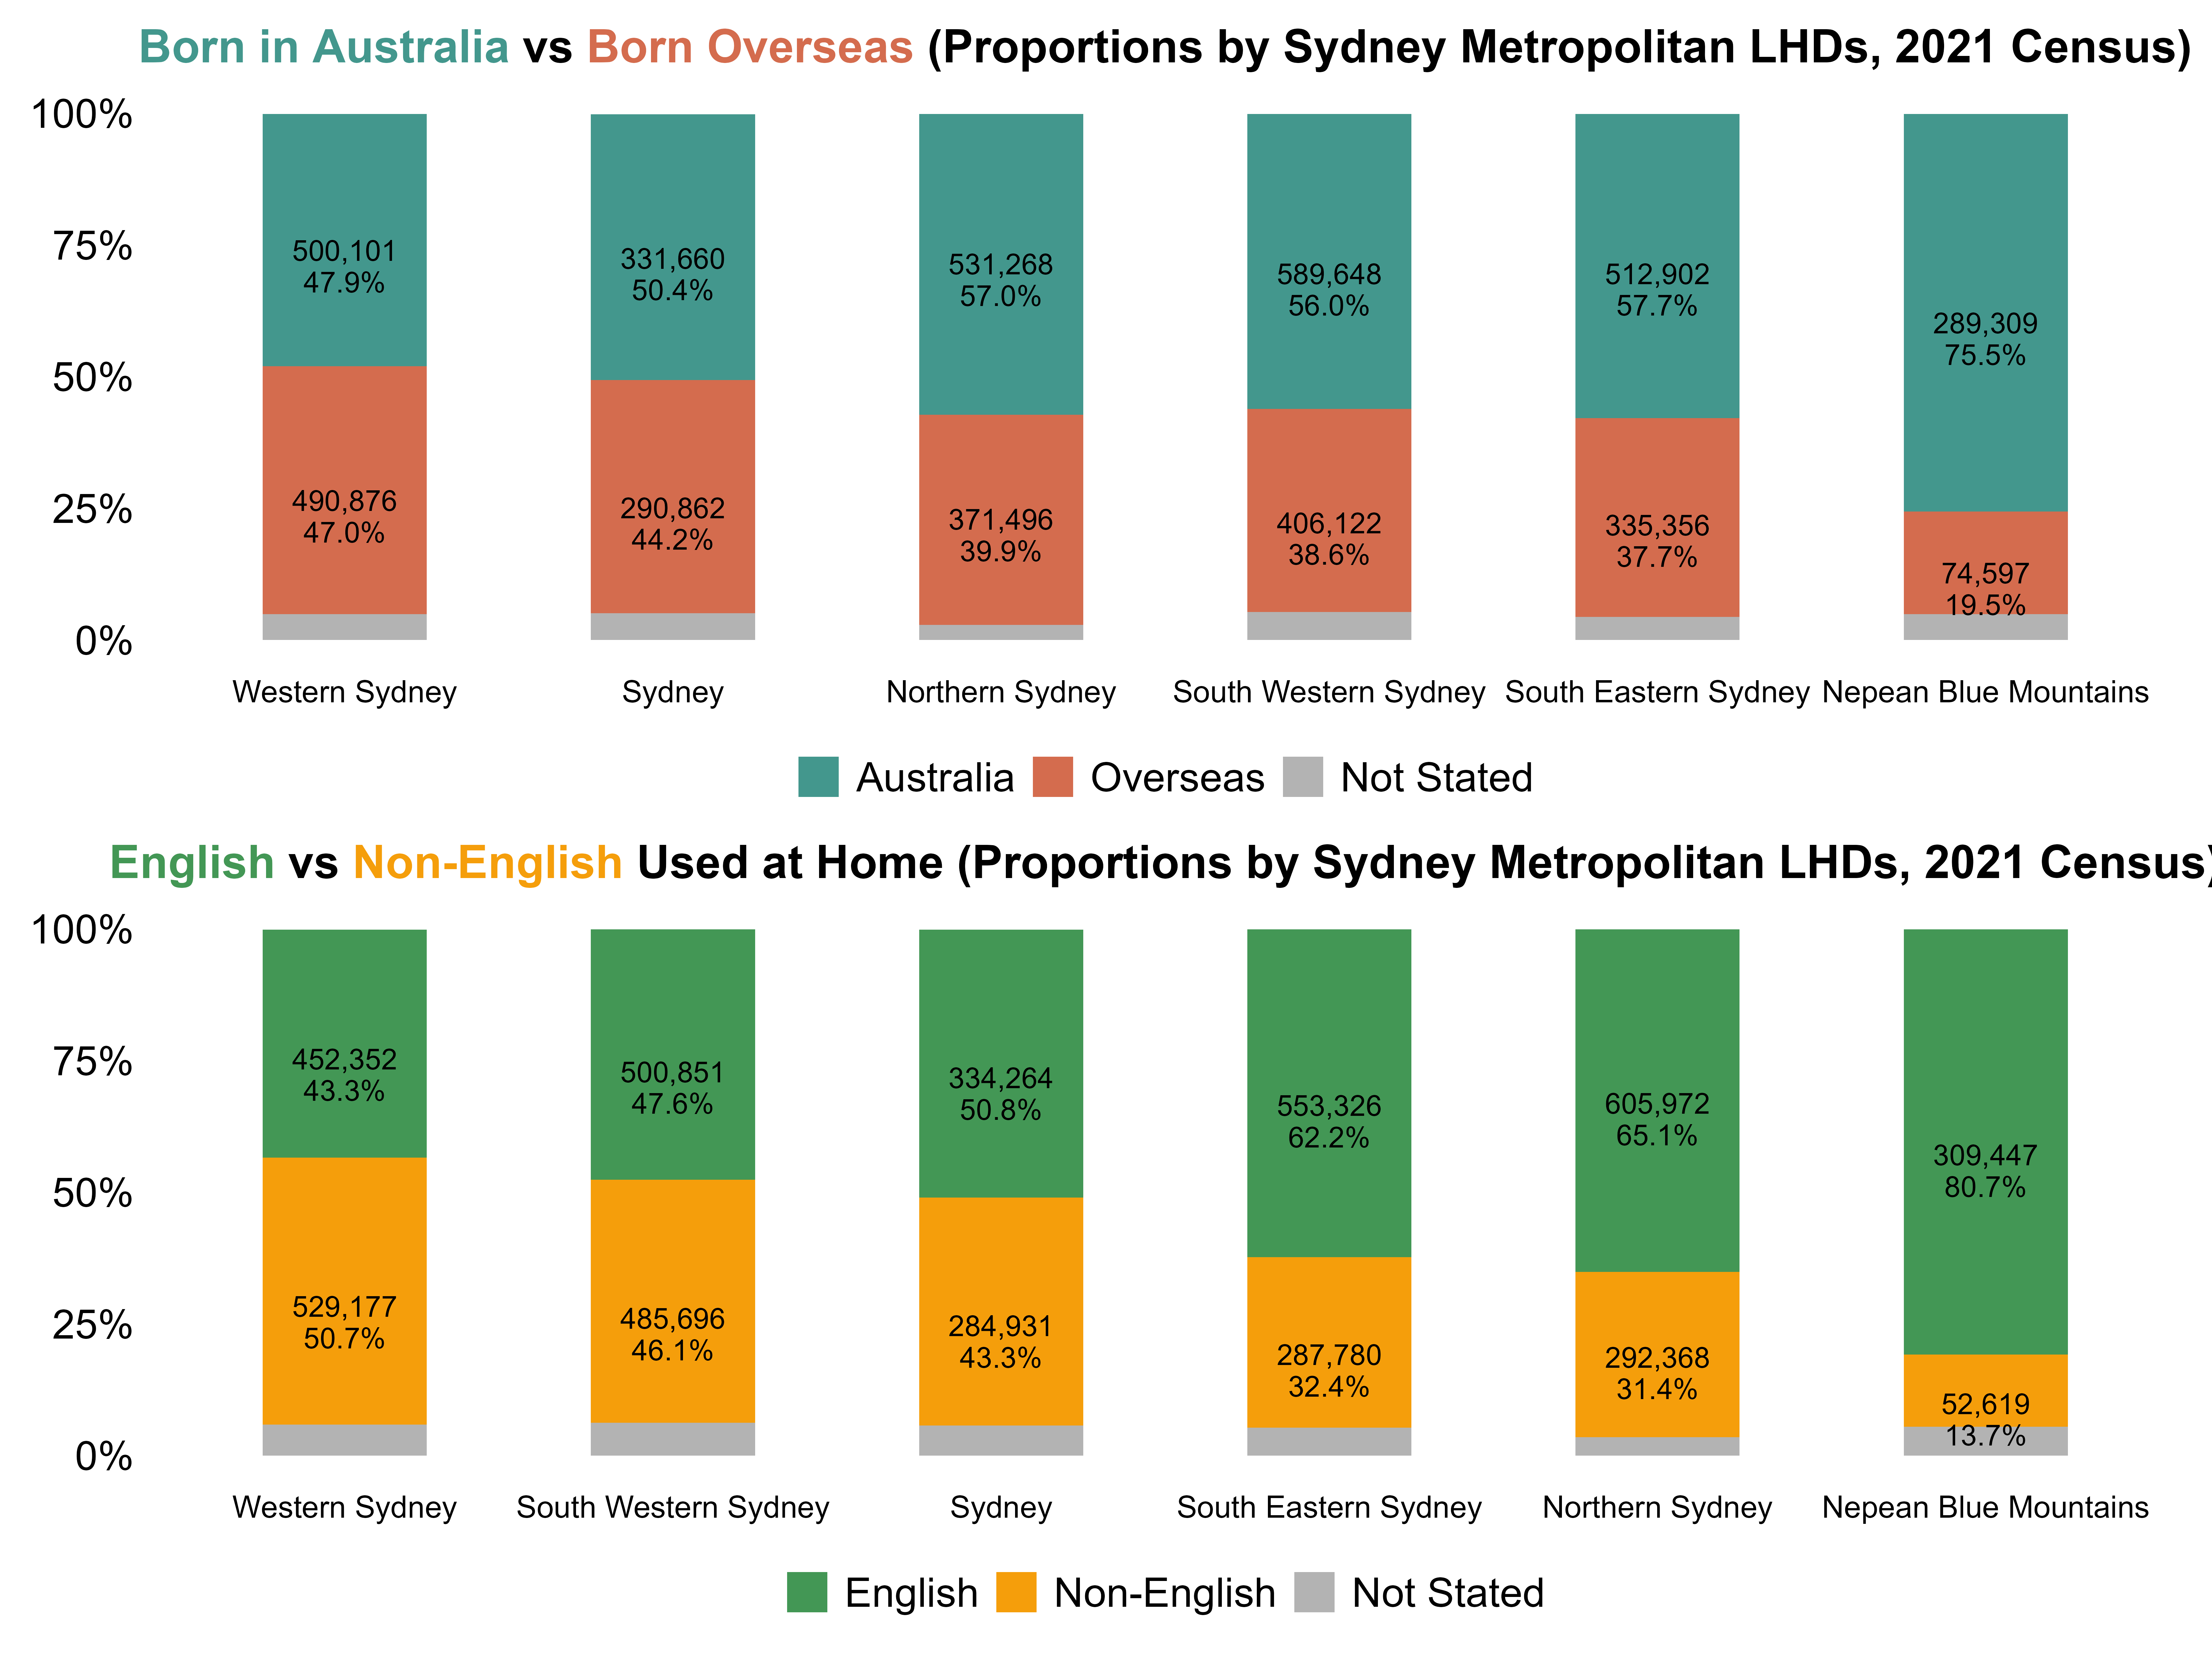
First, we examine the distribution of country of birth across the metropolitan LHDs.
In 2021, 47.0% of WSLHD’s population was born overseas, the highest proportion among all metropolitan LHDs.
However, it’s not just country of birth, language used at home matters too.
The languages used at home show a similar proportion.
In 2021, people who used non-English languages at home made up more than 50% of WSLHD.
This highlights Western Sydney as the most culturally diverse part of Sydney metropolitan.
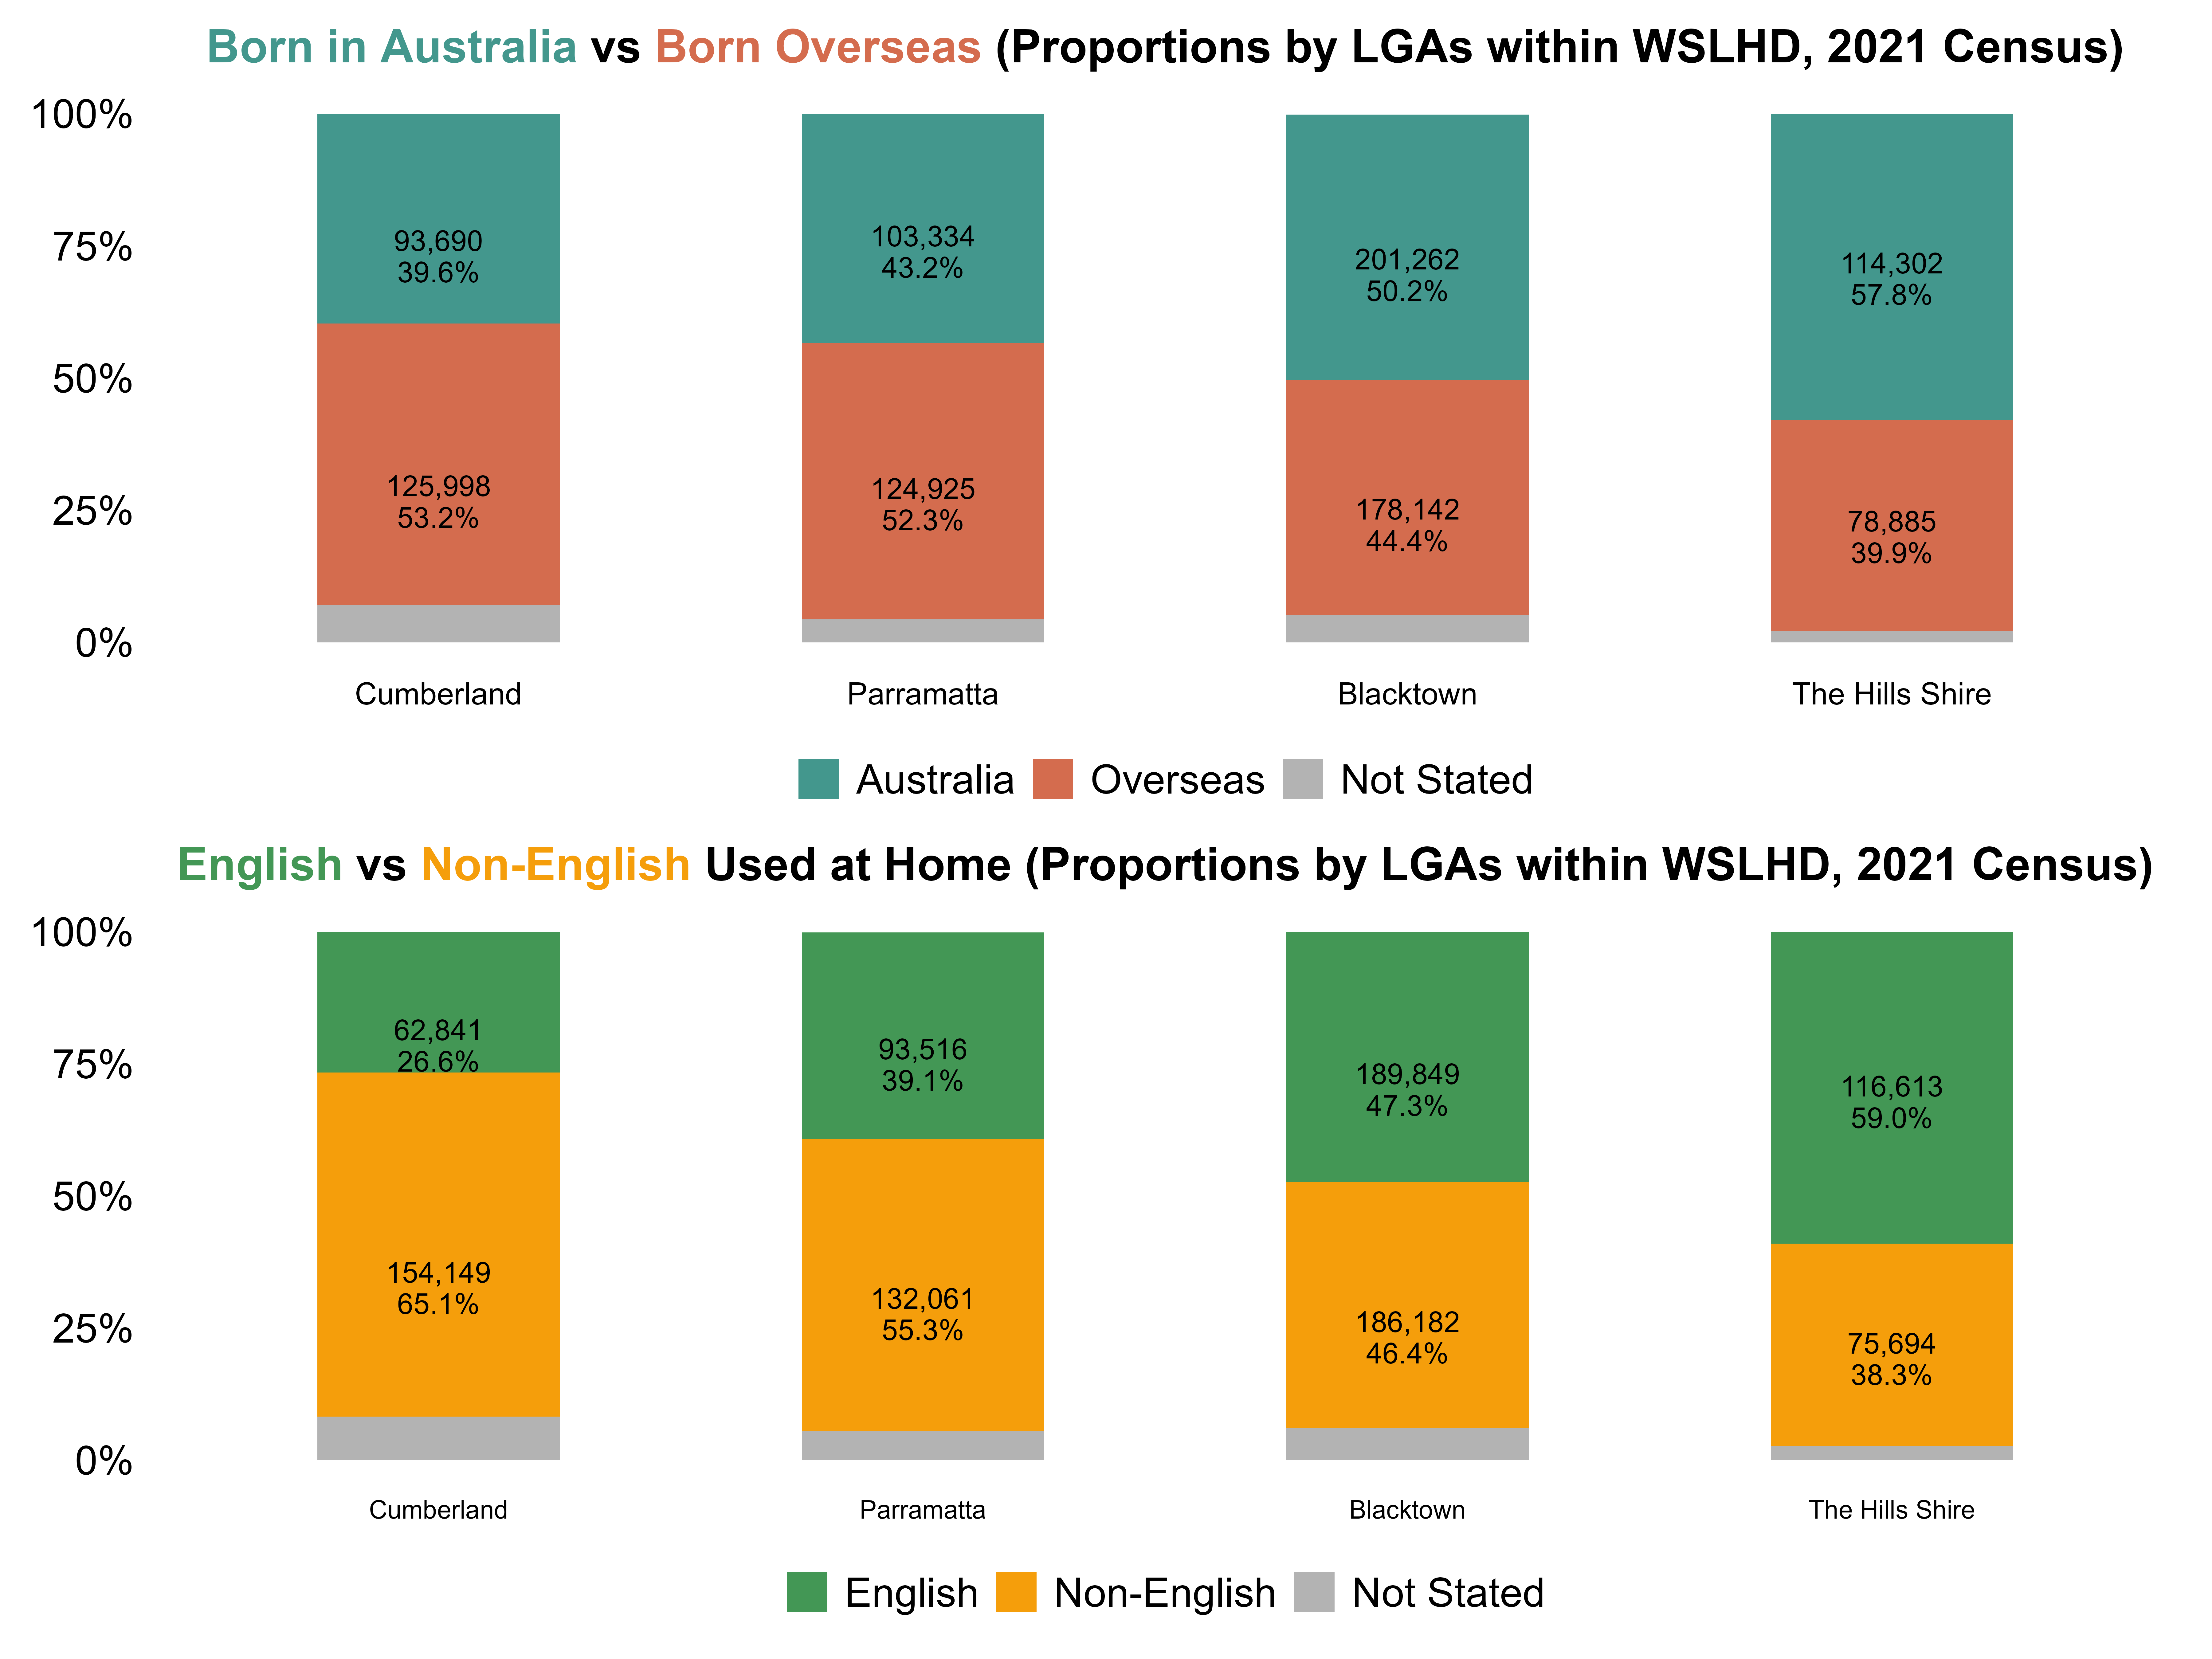
This pattern also makes us more interested in the migrant structure of Western Sydney, so we continue to break down WSLHD.
Across WSLHD, Cumberland and Parramatta have a majority overseas-born population (~52–53%).
Blacktown is roughly balanced (~50/50), while The Hills Shire is more Australian-born (~58%).
Home-language patterns mirror this:
In Cumberland and Parramatta, the majority of residents do not speak English at home (55–65%).
Blacktown is closer to an even split, while in The Hills Shire, most residents speak English at home (~59%).
So what we really want to know:
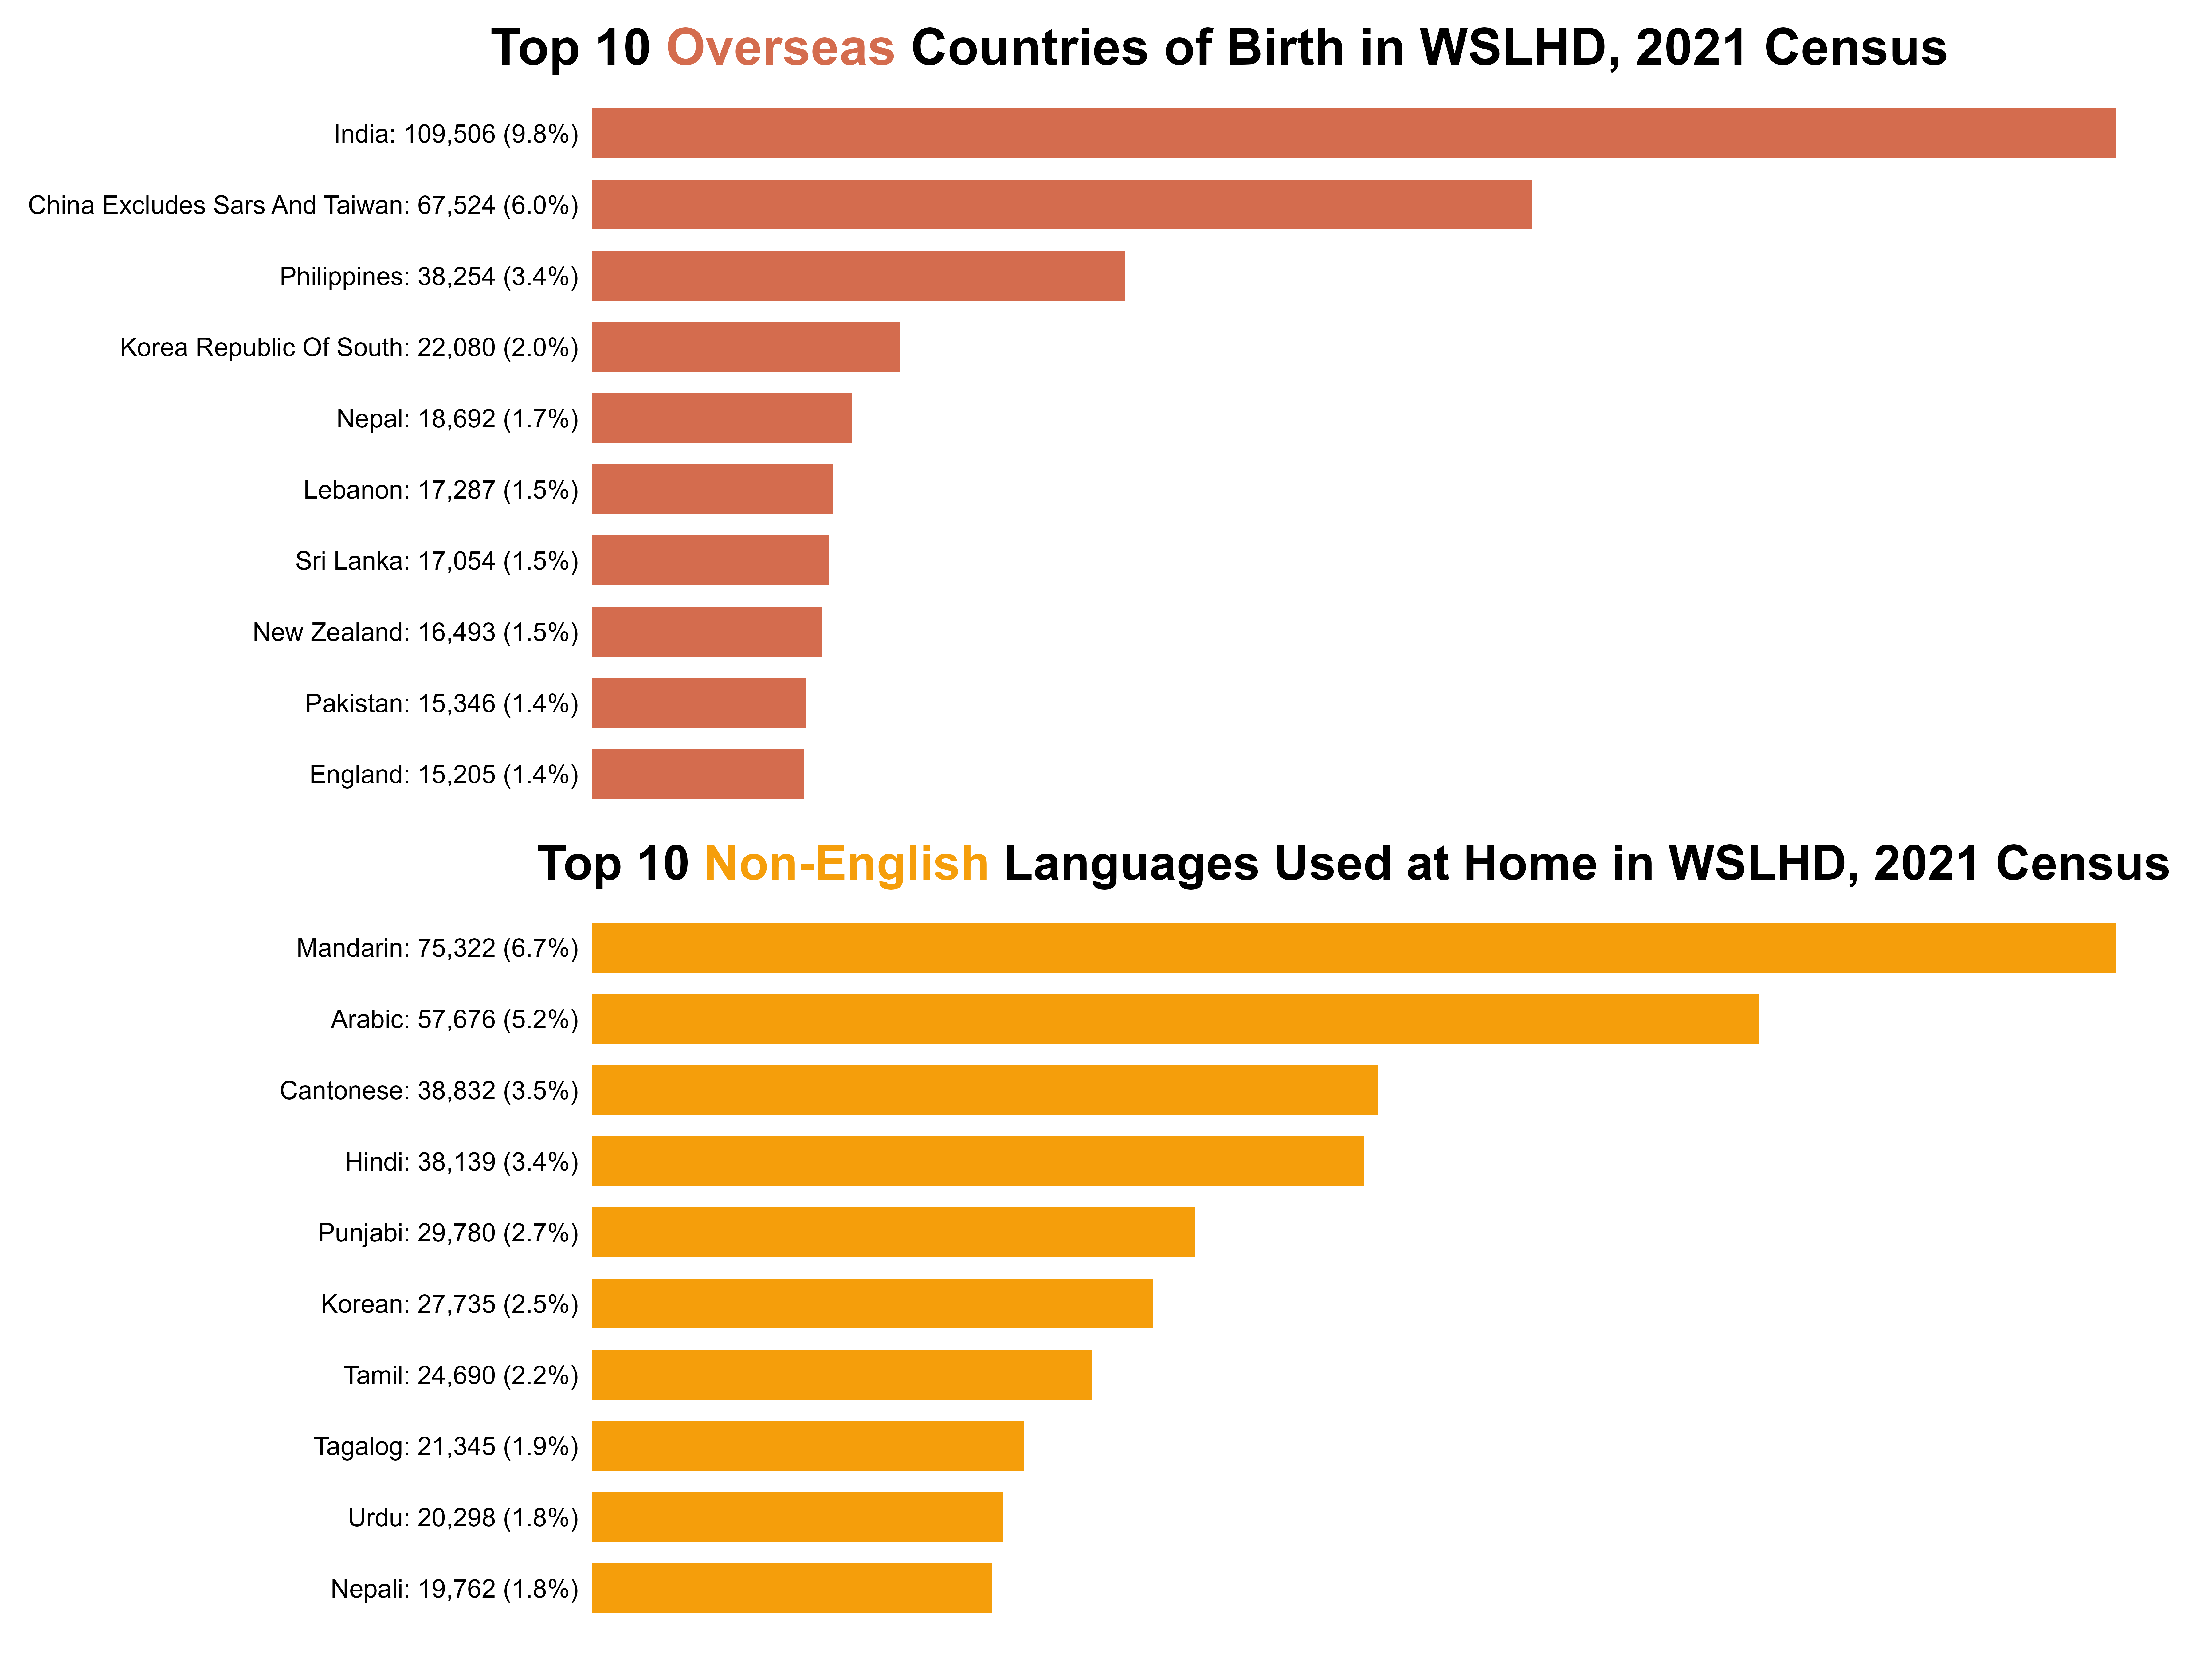
Who are the main migrant communities in Western Sydney?
Here, we integrate the top 10 overseas countries of birth and the top 10 non-English languages used at home to see how migration and language connect across WSLHD.
India leads by a large margin, with China and the Philippines next.
Other countries like South Korea, Nepal, Lebanon, and Sri Lanka add to the rich mix of communities across Western Sydney.
Mandarin, Arabic, Cantonese, and Hindi are leading the way.
Punjabi, Korean, Tamil, and Tagalog are also commonly used at home.
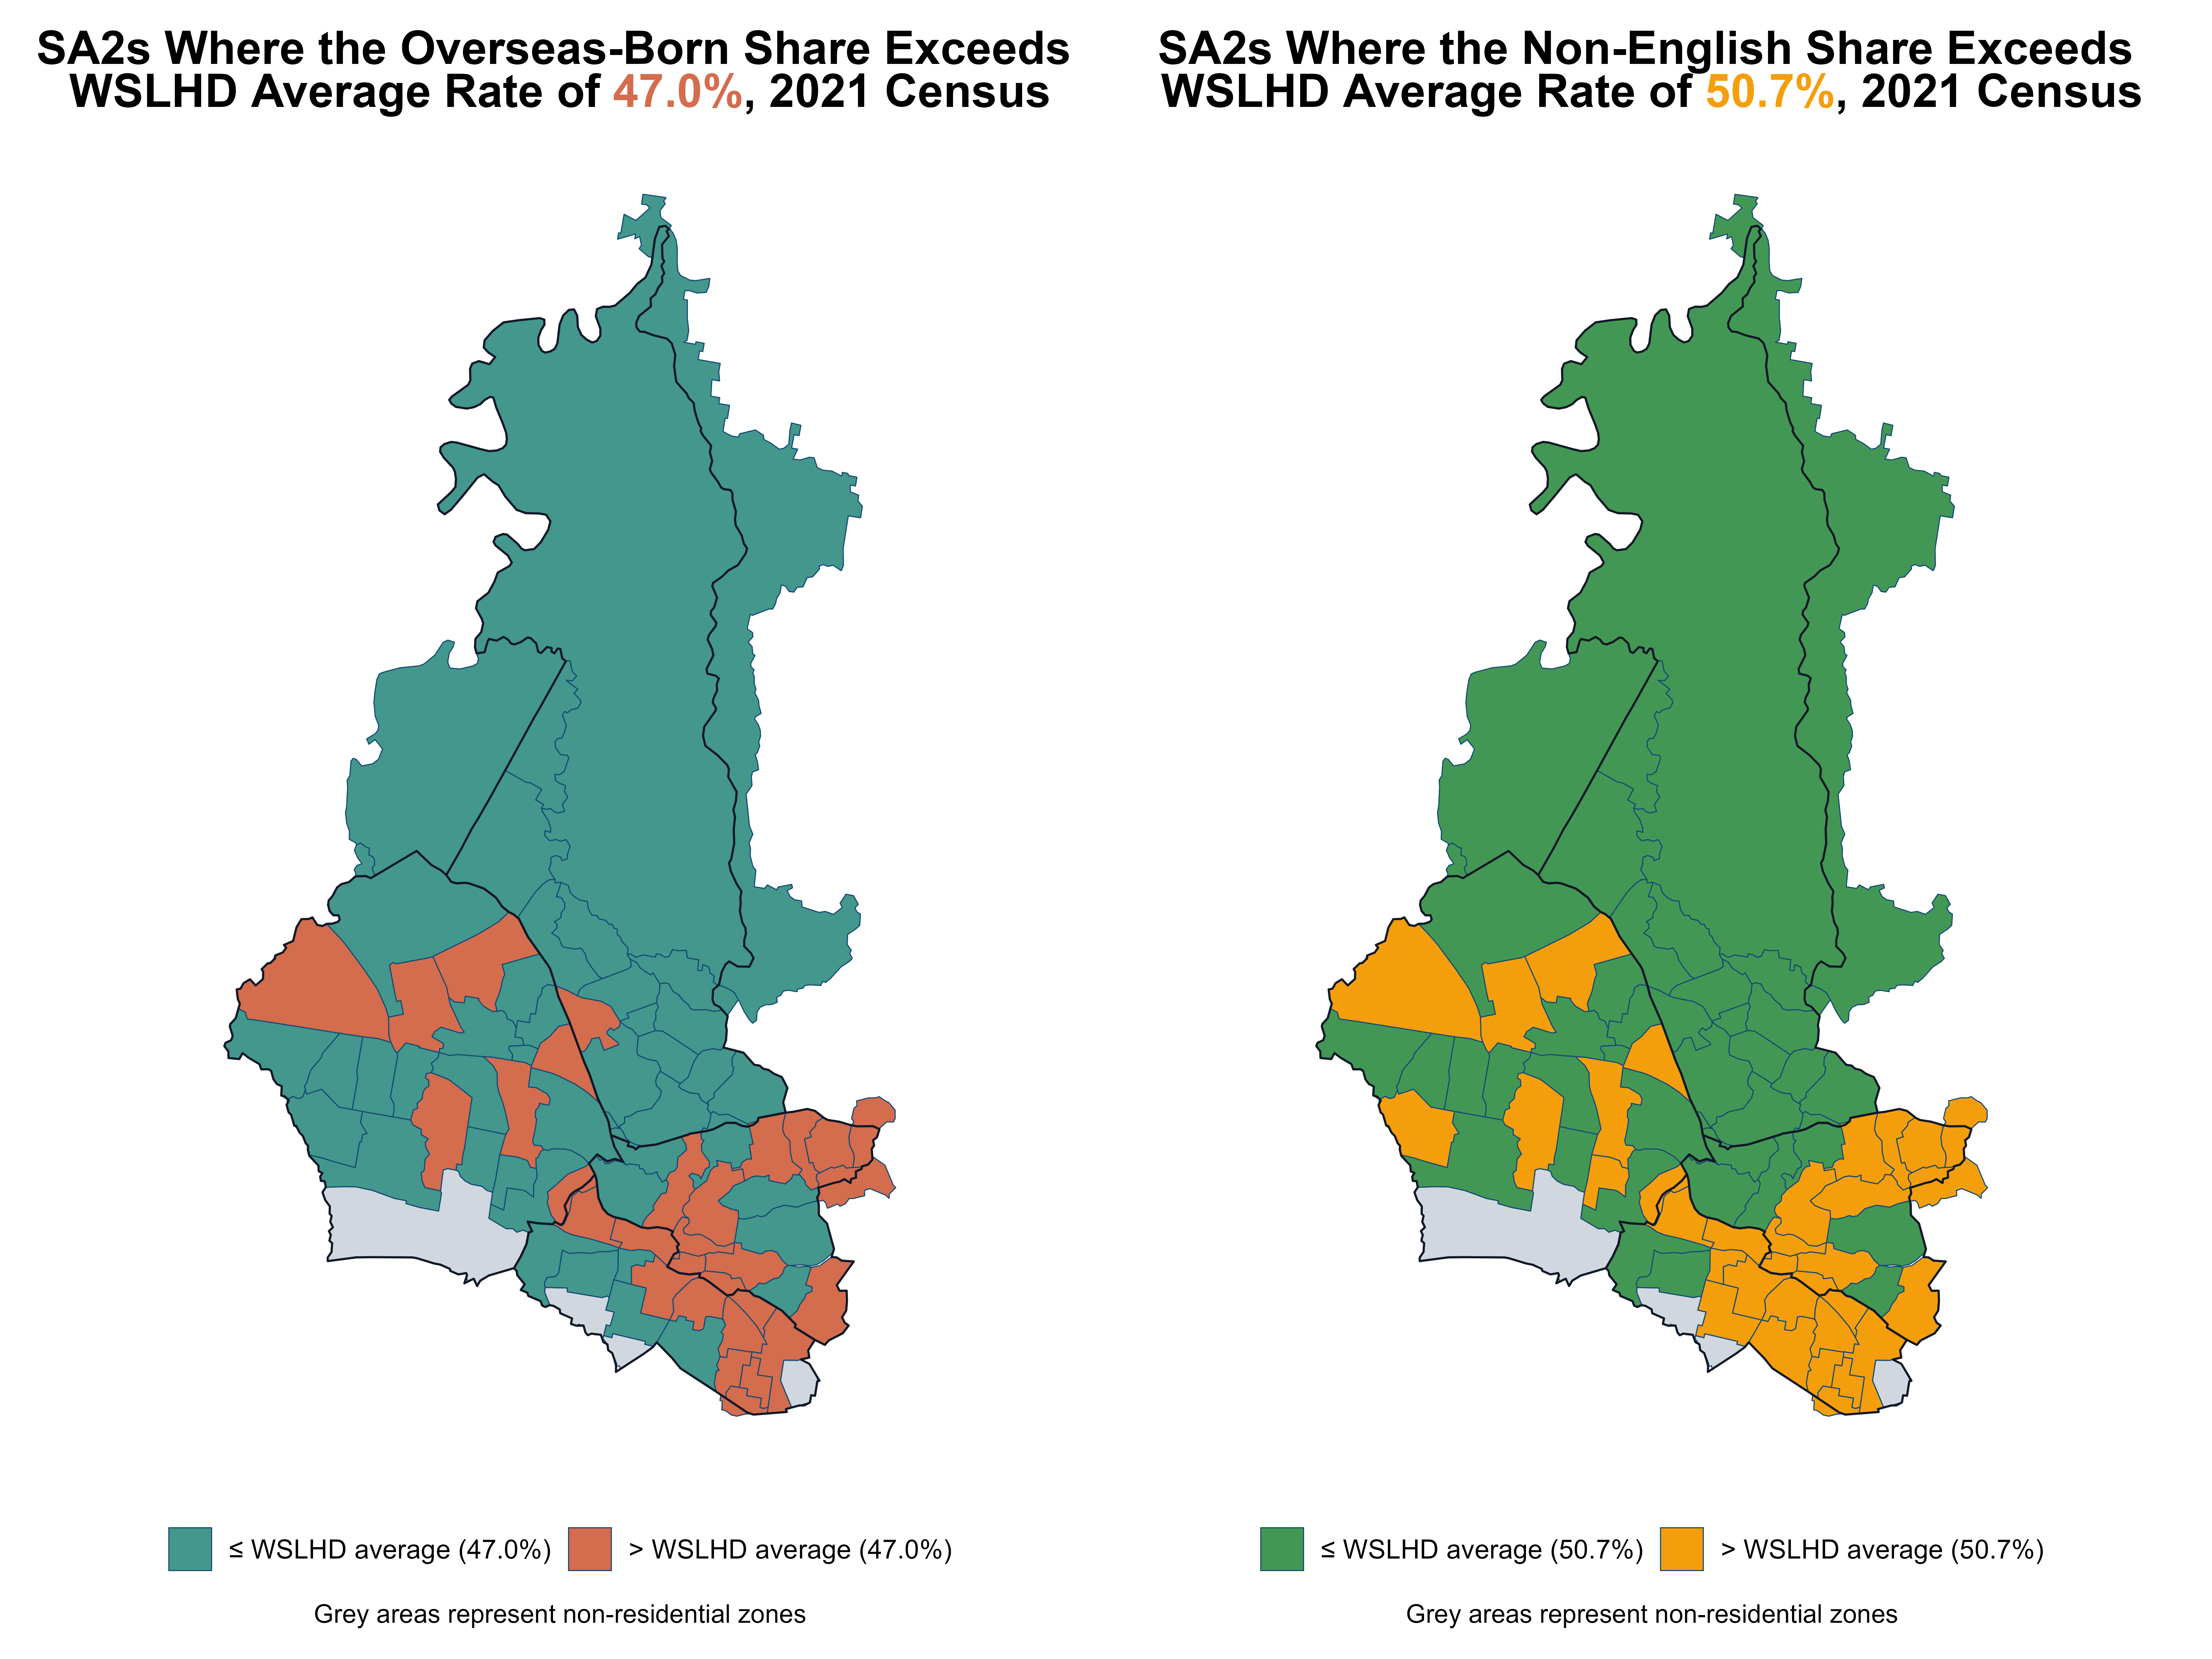
Also, I identified the SA2s where both the overseas-born population and the share of non-English languages used at home are higher than WSLHD’s overall averages.
These hotspots are largely clustered in Cumberland and Parramatta.
In WSLHD, residents bring different educational backgrounds, work in diverse occupations, earn across a wide range of incomes, and live in many types of housing, which forms a dynamic and vibrant community.
Now, let’s explore the socioeconomic patterns within WSLHD.
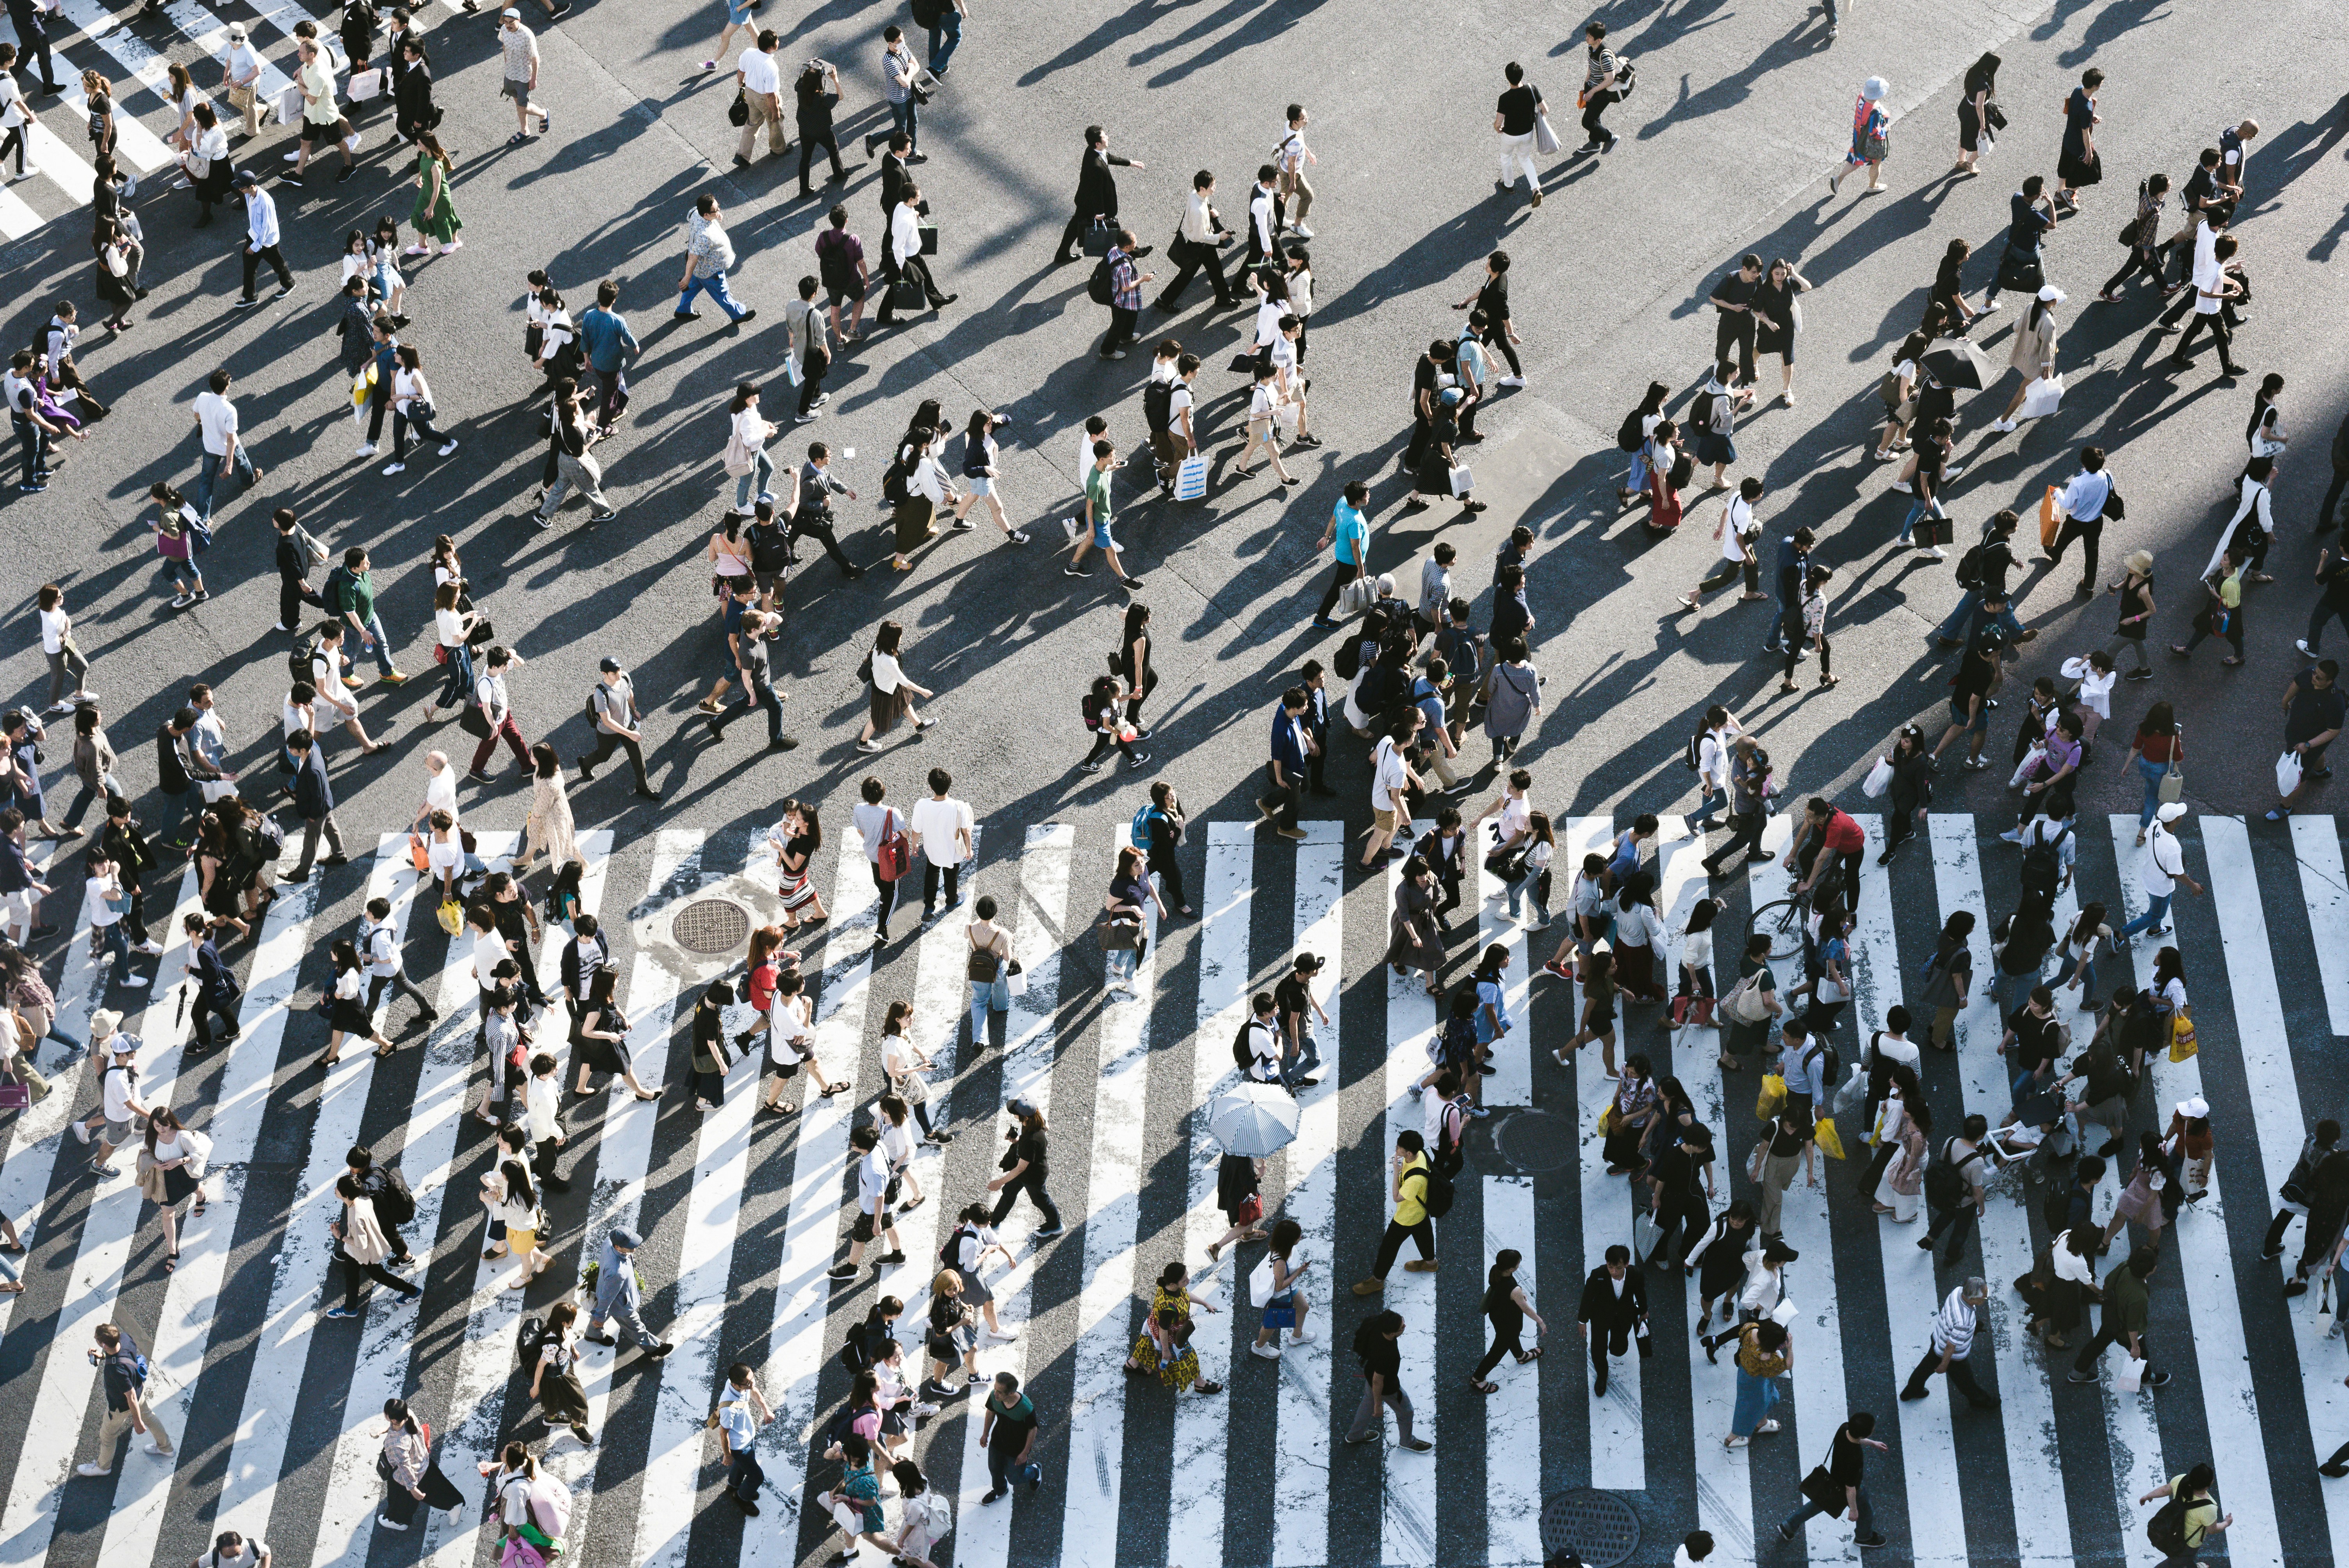
Here, we focus on four factors that are closely connected to everyday life, including:
- Education,
- Occupation,
- Personal Income,
- Housing Type
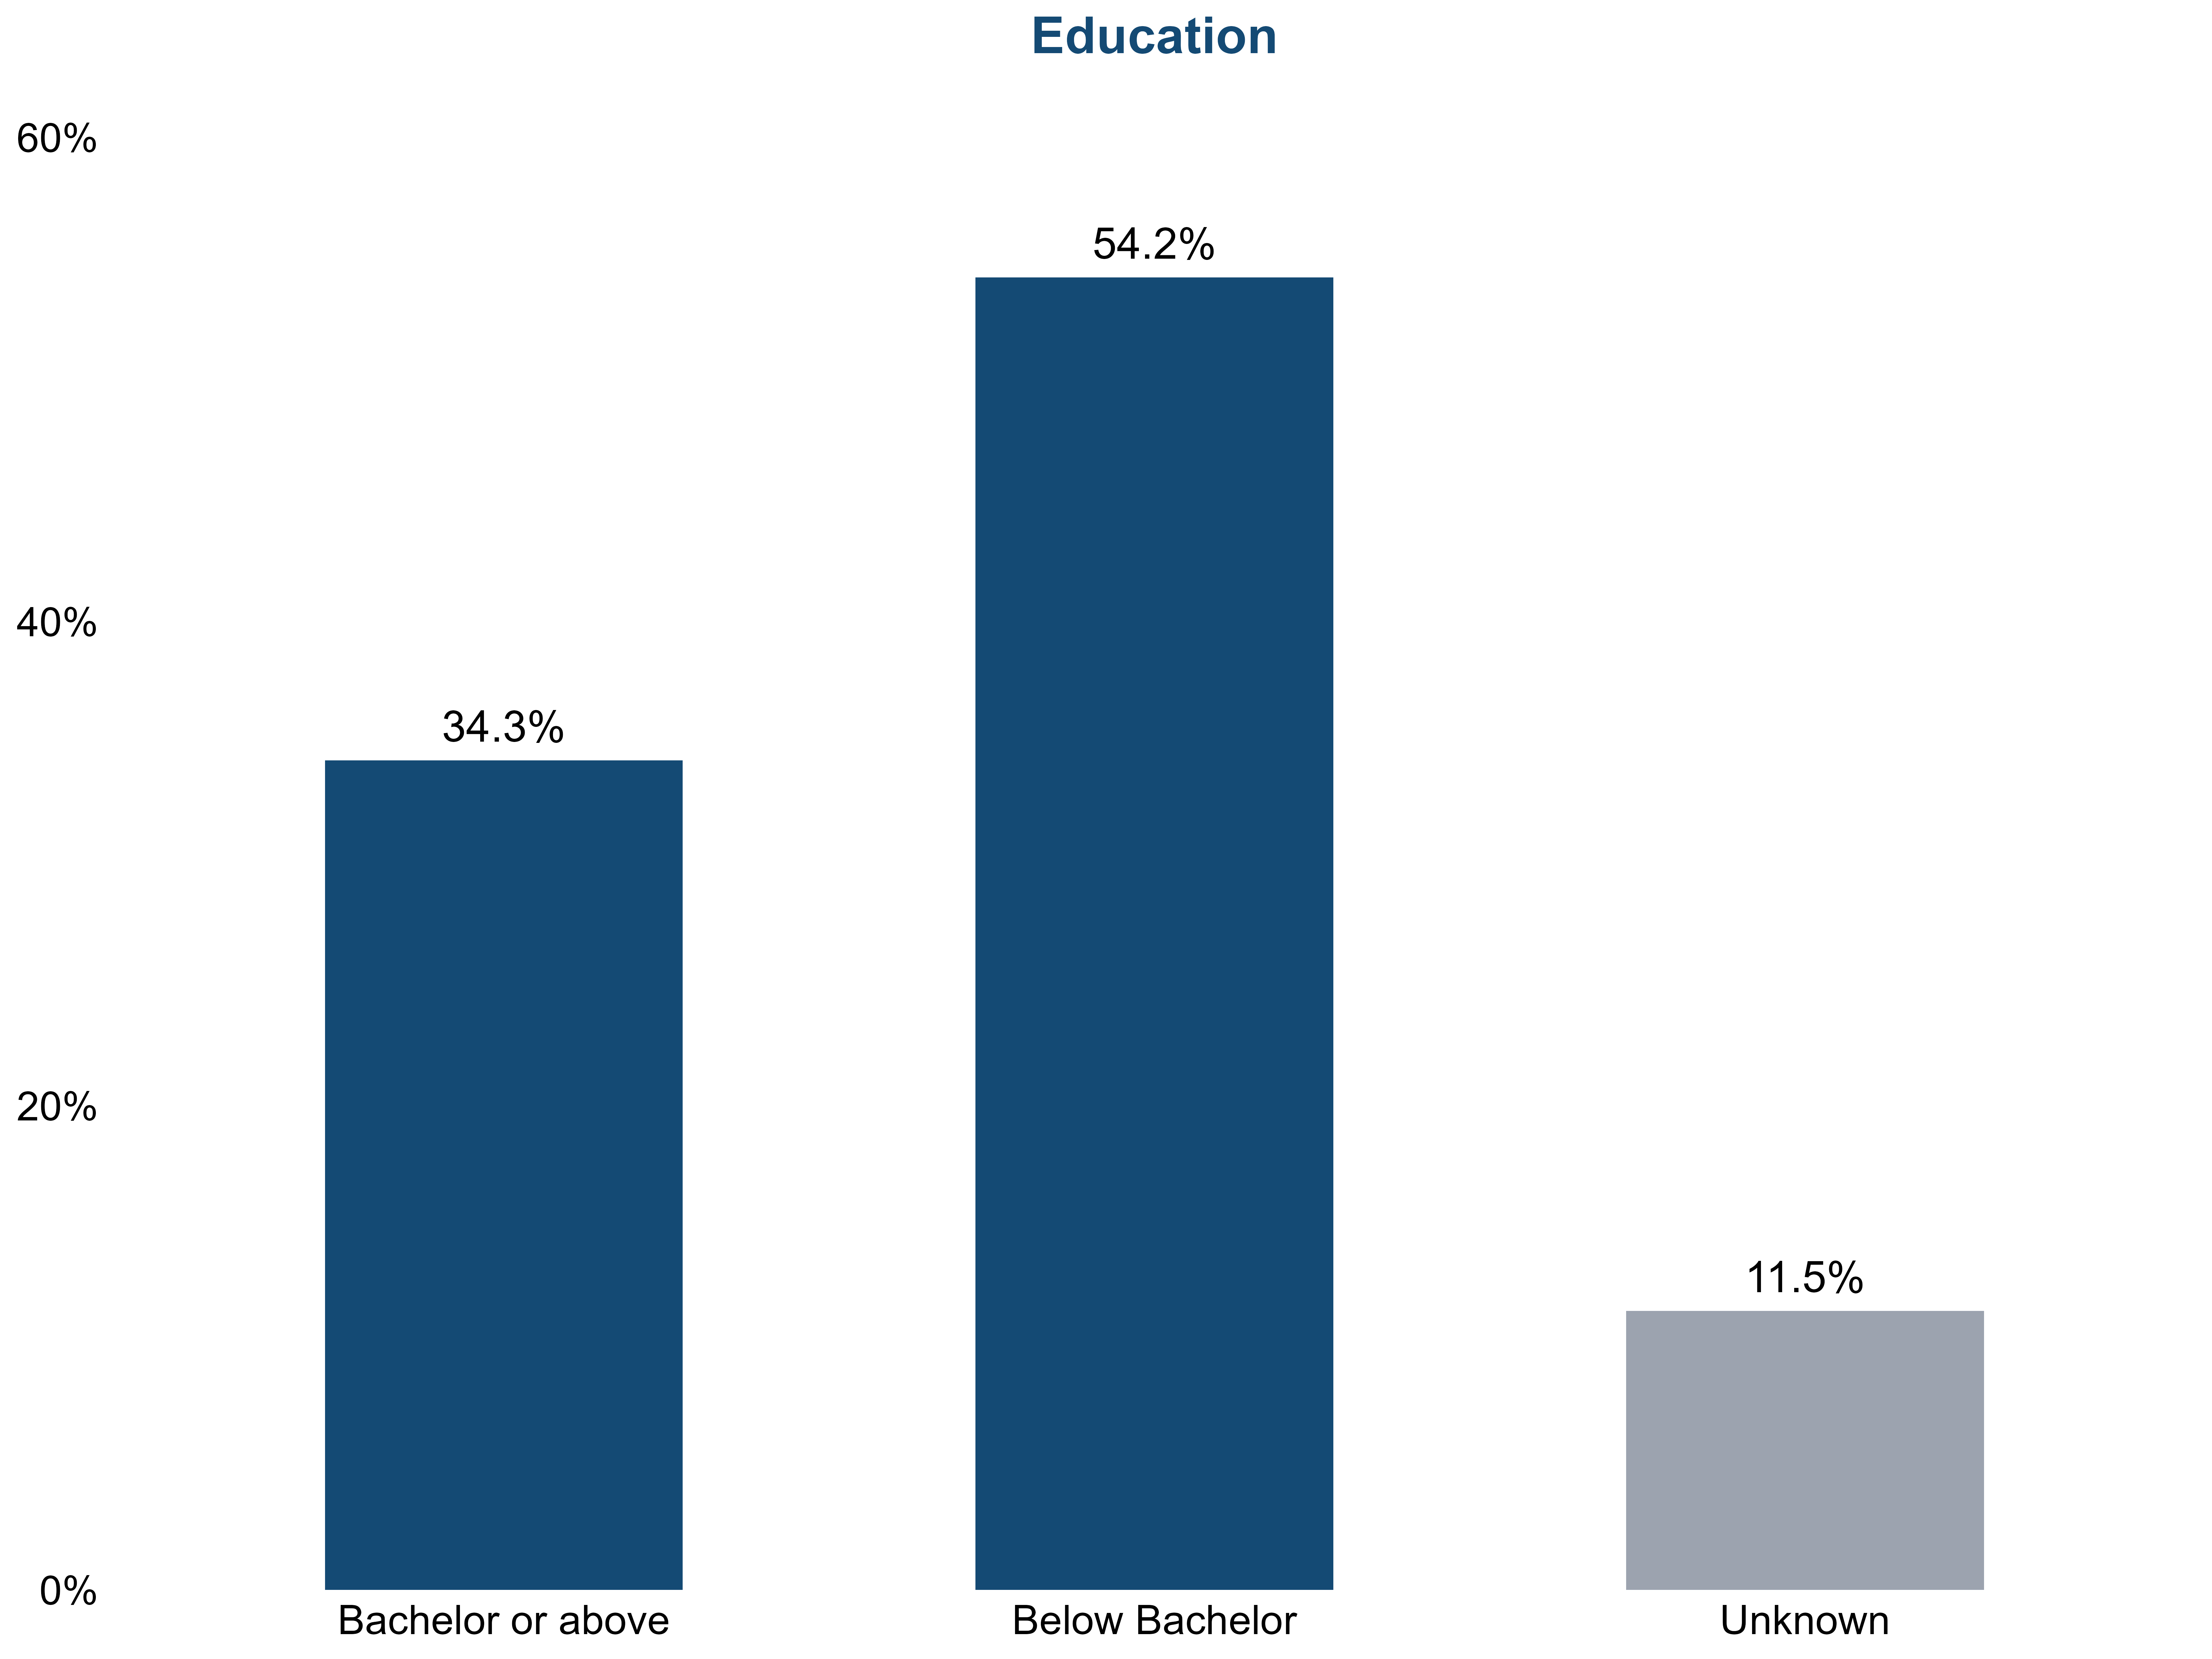
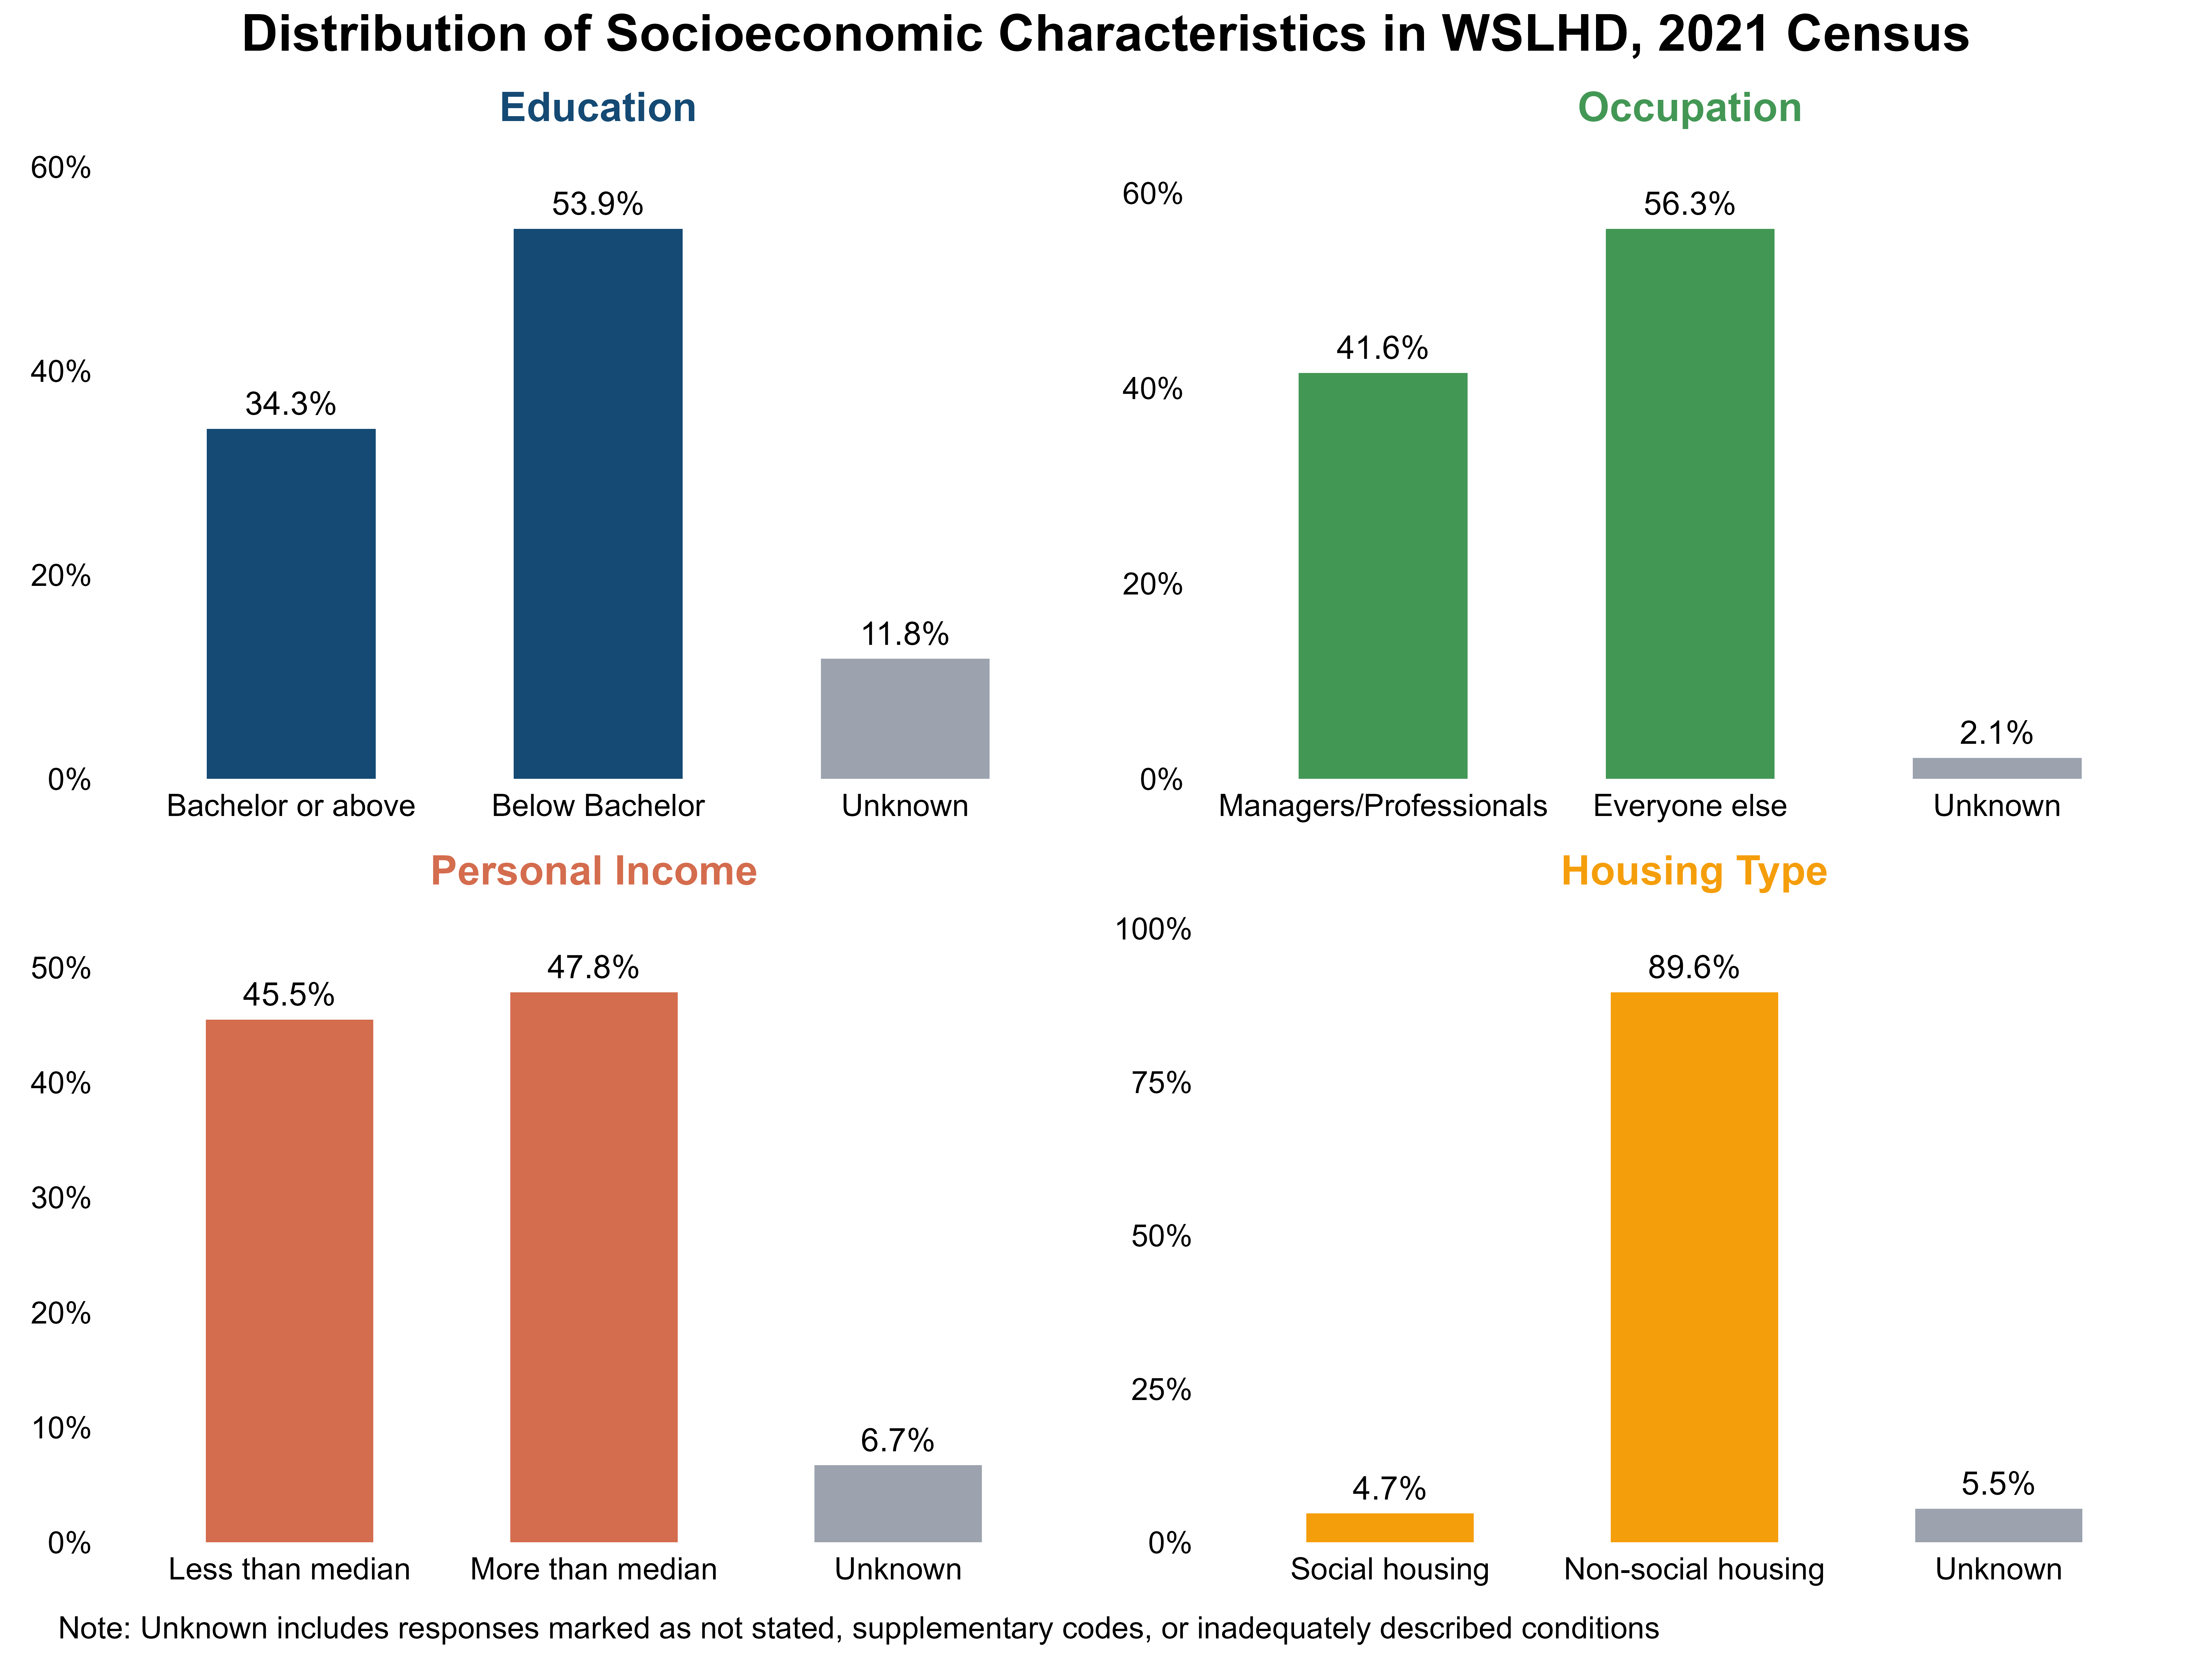
Among people aged 15 and over, the level of highest educational attainment shows that 34.3% had a bachelor’s degree or higher, while 53.9% hold qualifications below the bachelor level.
The pattern was broadly similar to the metropolitan average.
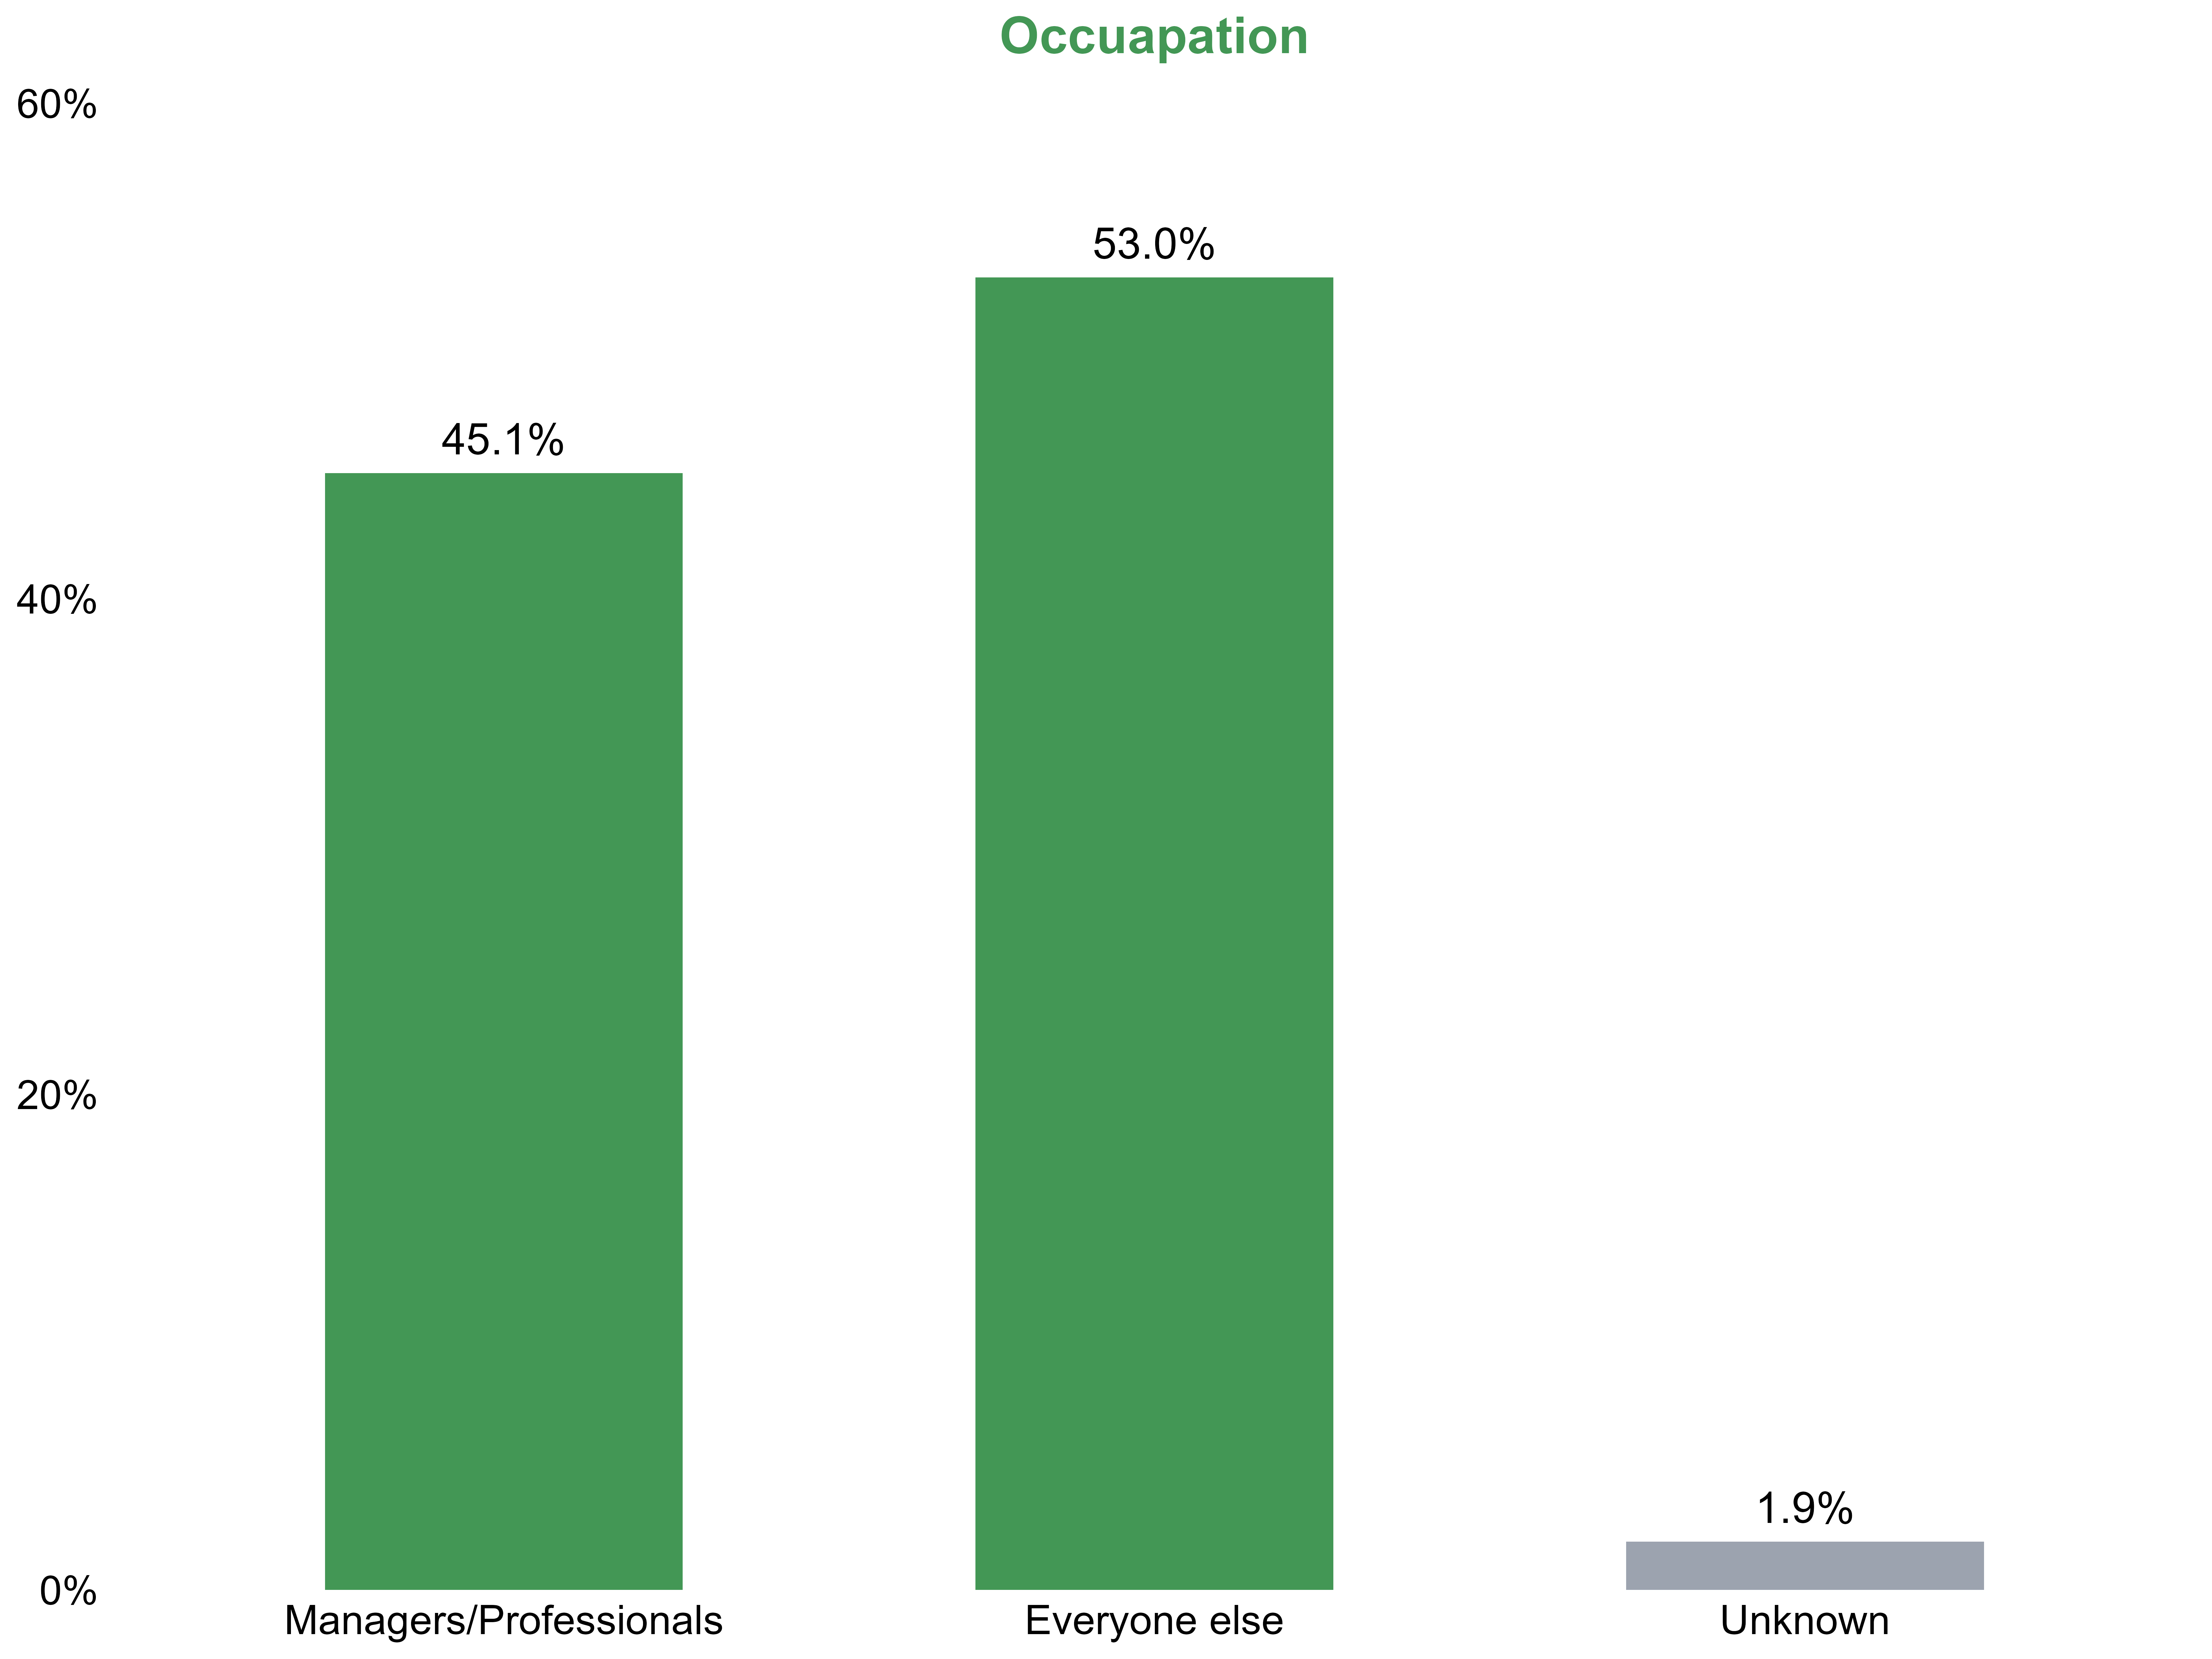
Among employed persons aged 15 years and over, 41.6% were managers or professionals, while 56.3%worked in non-professional roles.
Compared with the metropolitan average, the share of managerial and professional occupations was 3.5% lower, while the share of non-professional roles was 3.3% higher.
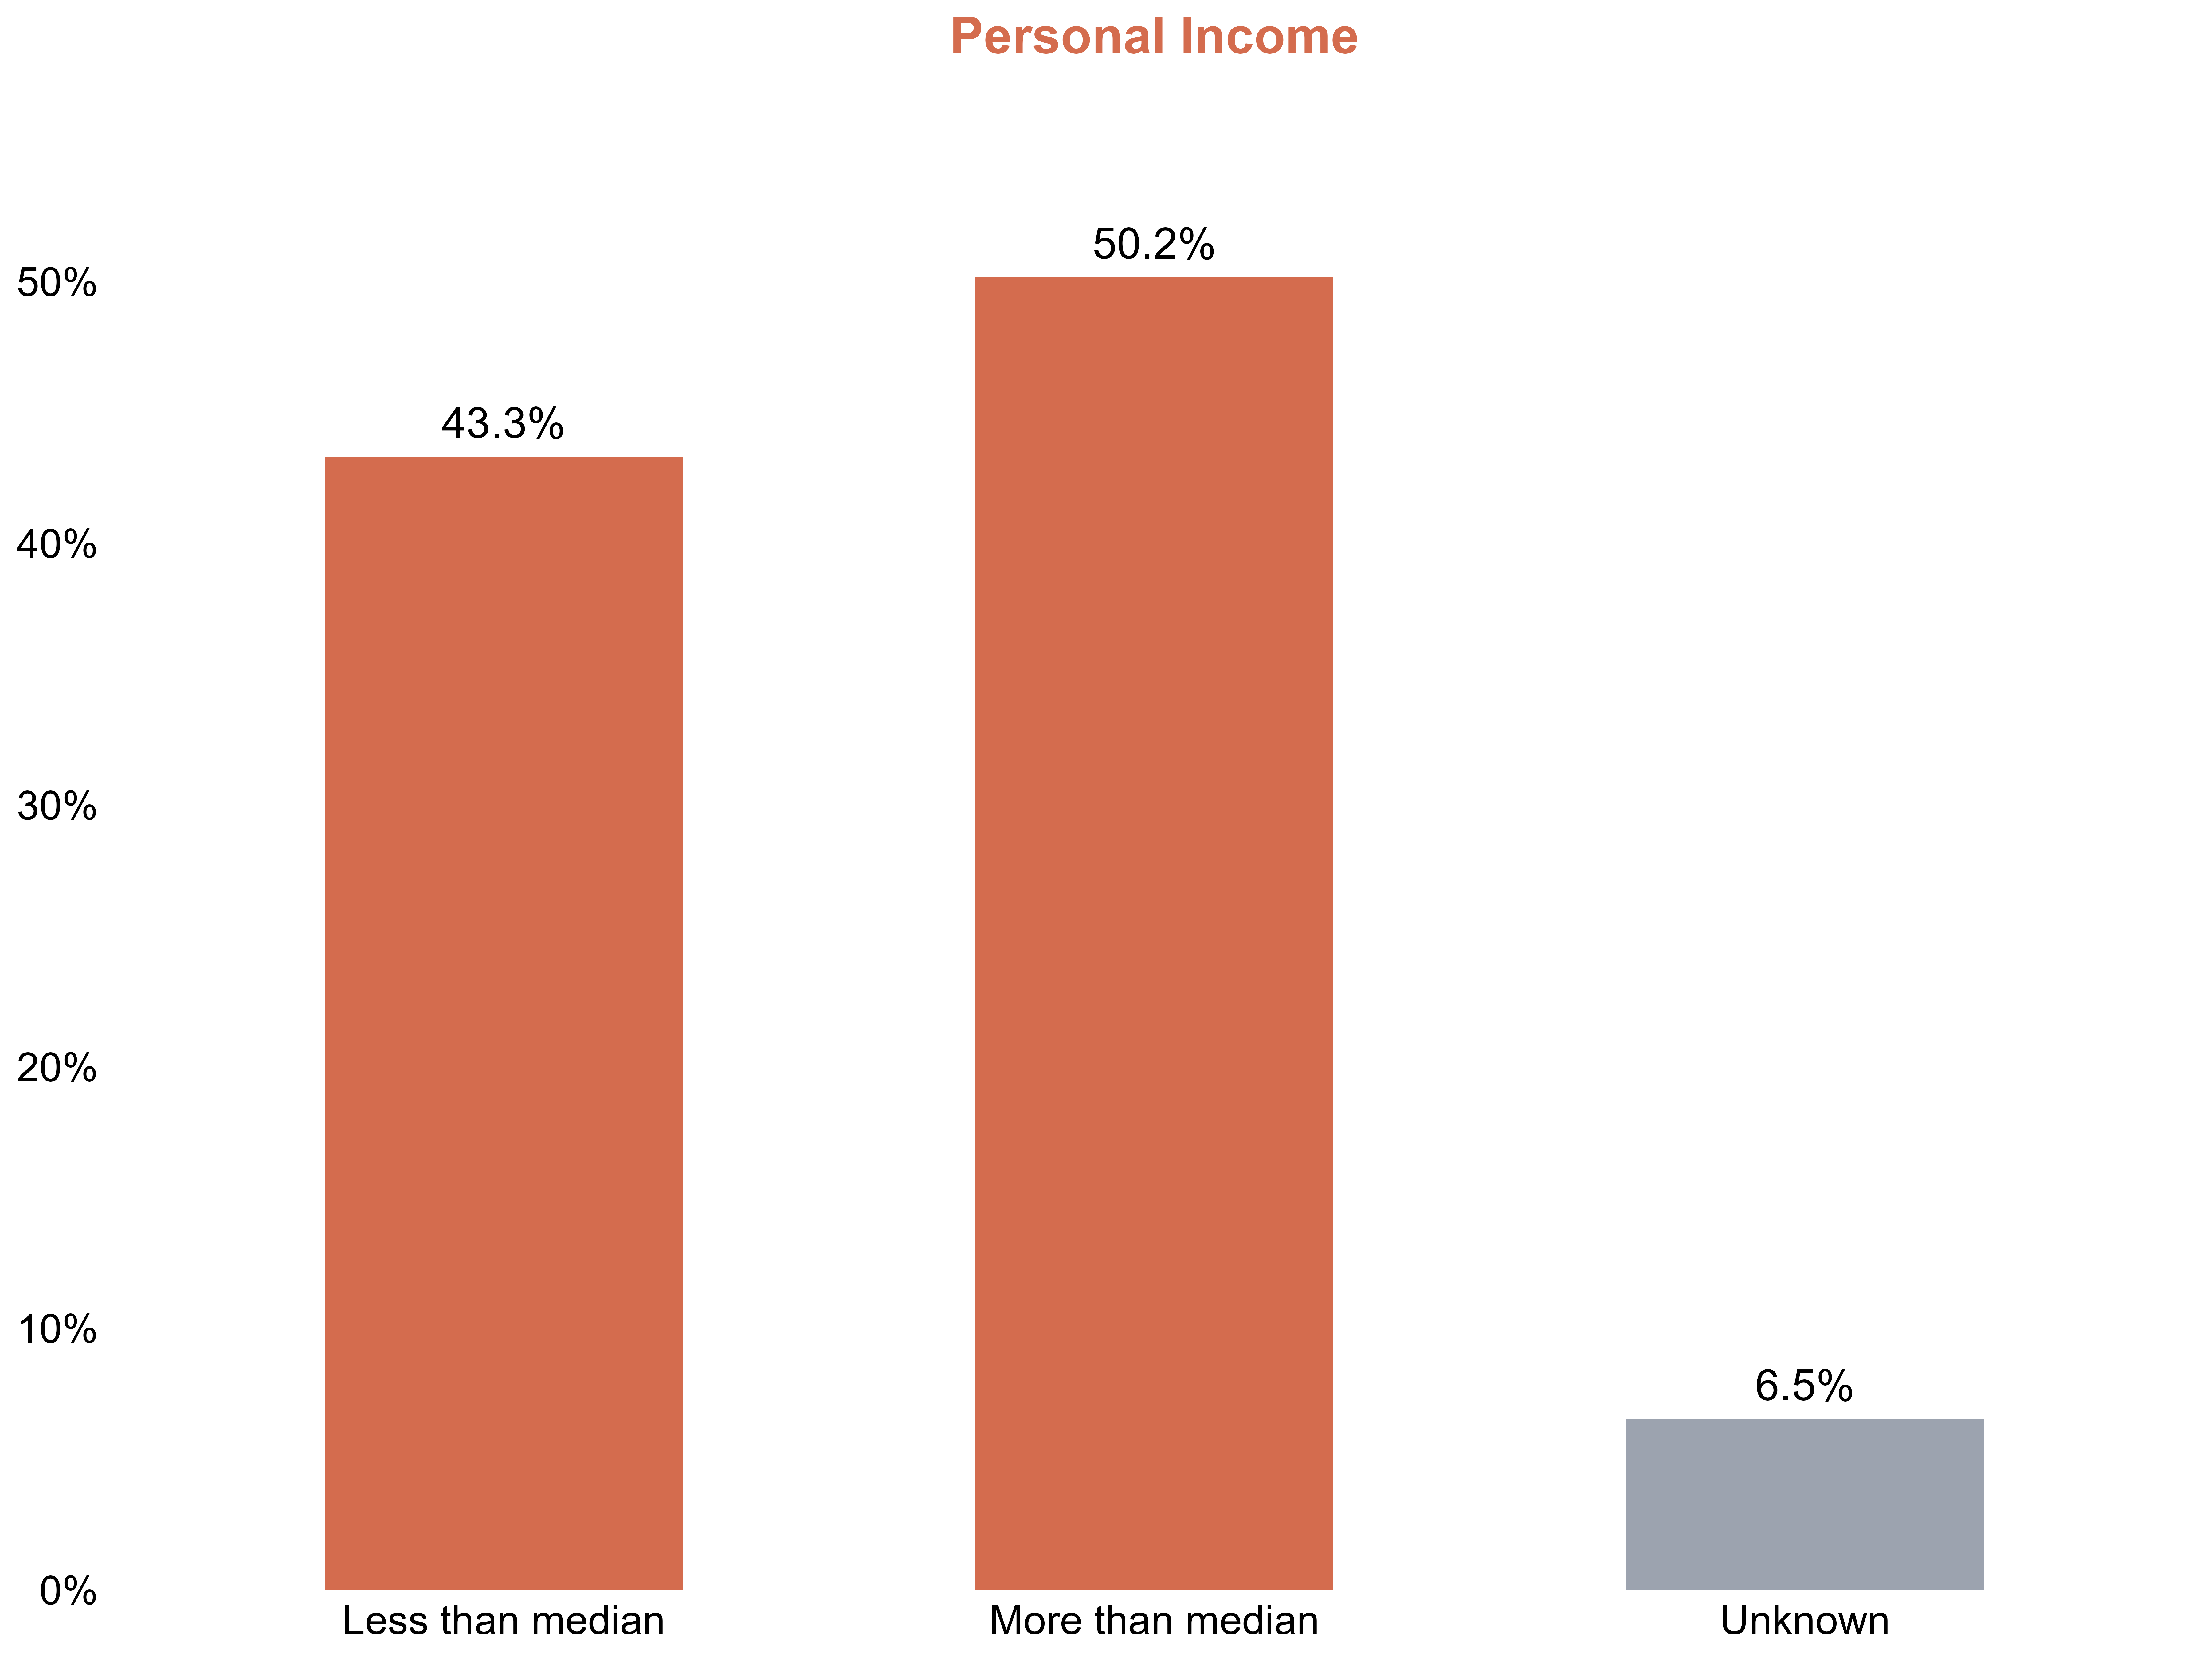
Personal income was classified using the 2021 NSW median weekly personal income of $813 as the baseline.
Note: Income data can only be obtained in ranges rather than exact amounts, so minor boundary effects exist.
Among people aged 15 and over, about 45.5% of residents earned less than the NSW median, representing more than 400,000 people.
In contrast, those earning at or above the median accounted for around 425,000 (47.8%) residents.
Compared with the metropolitan average, the share of low-income earners in WSLHD was around 2.2% higher, while the share of middle-high-income earners was about 2.4% lower.
Around 4.7% of occupied dwellings in WSLHD was social housing, slightly above the metropolitan average of 4.1%.
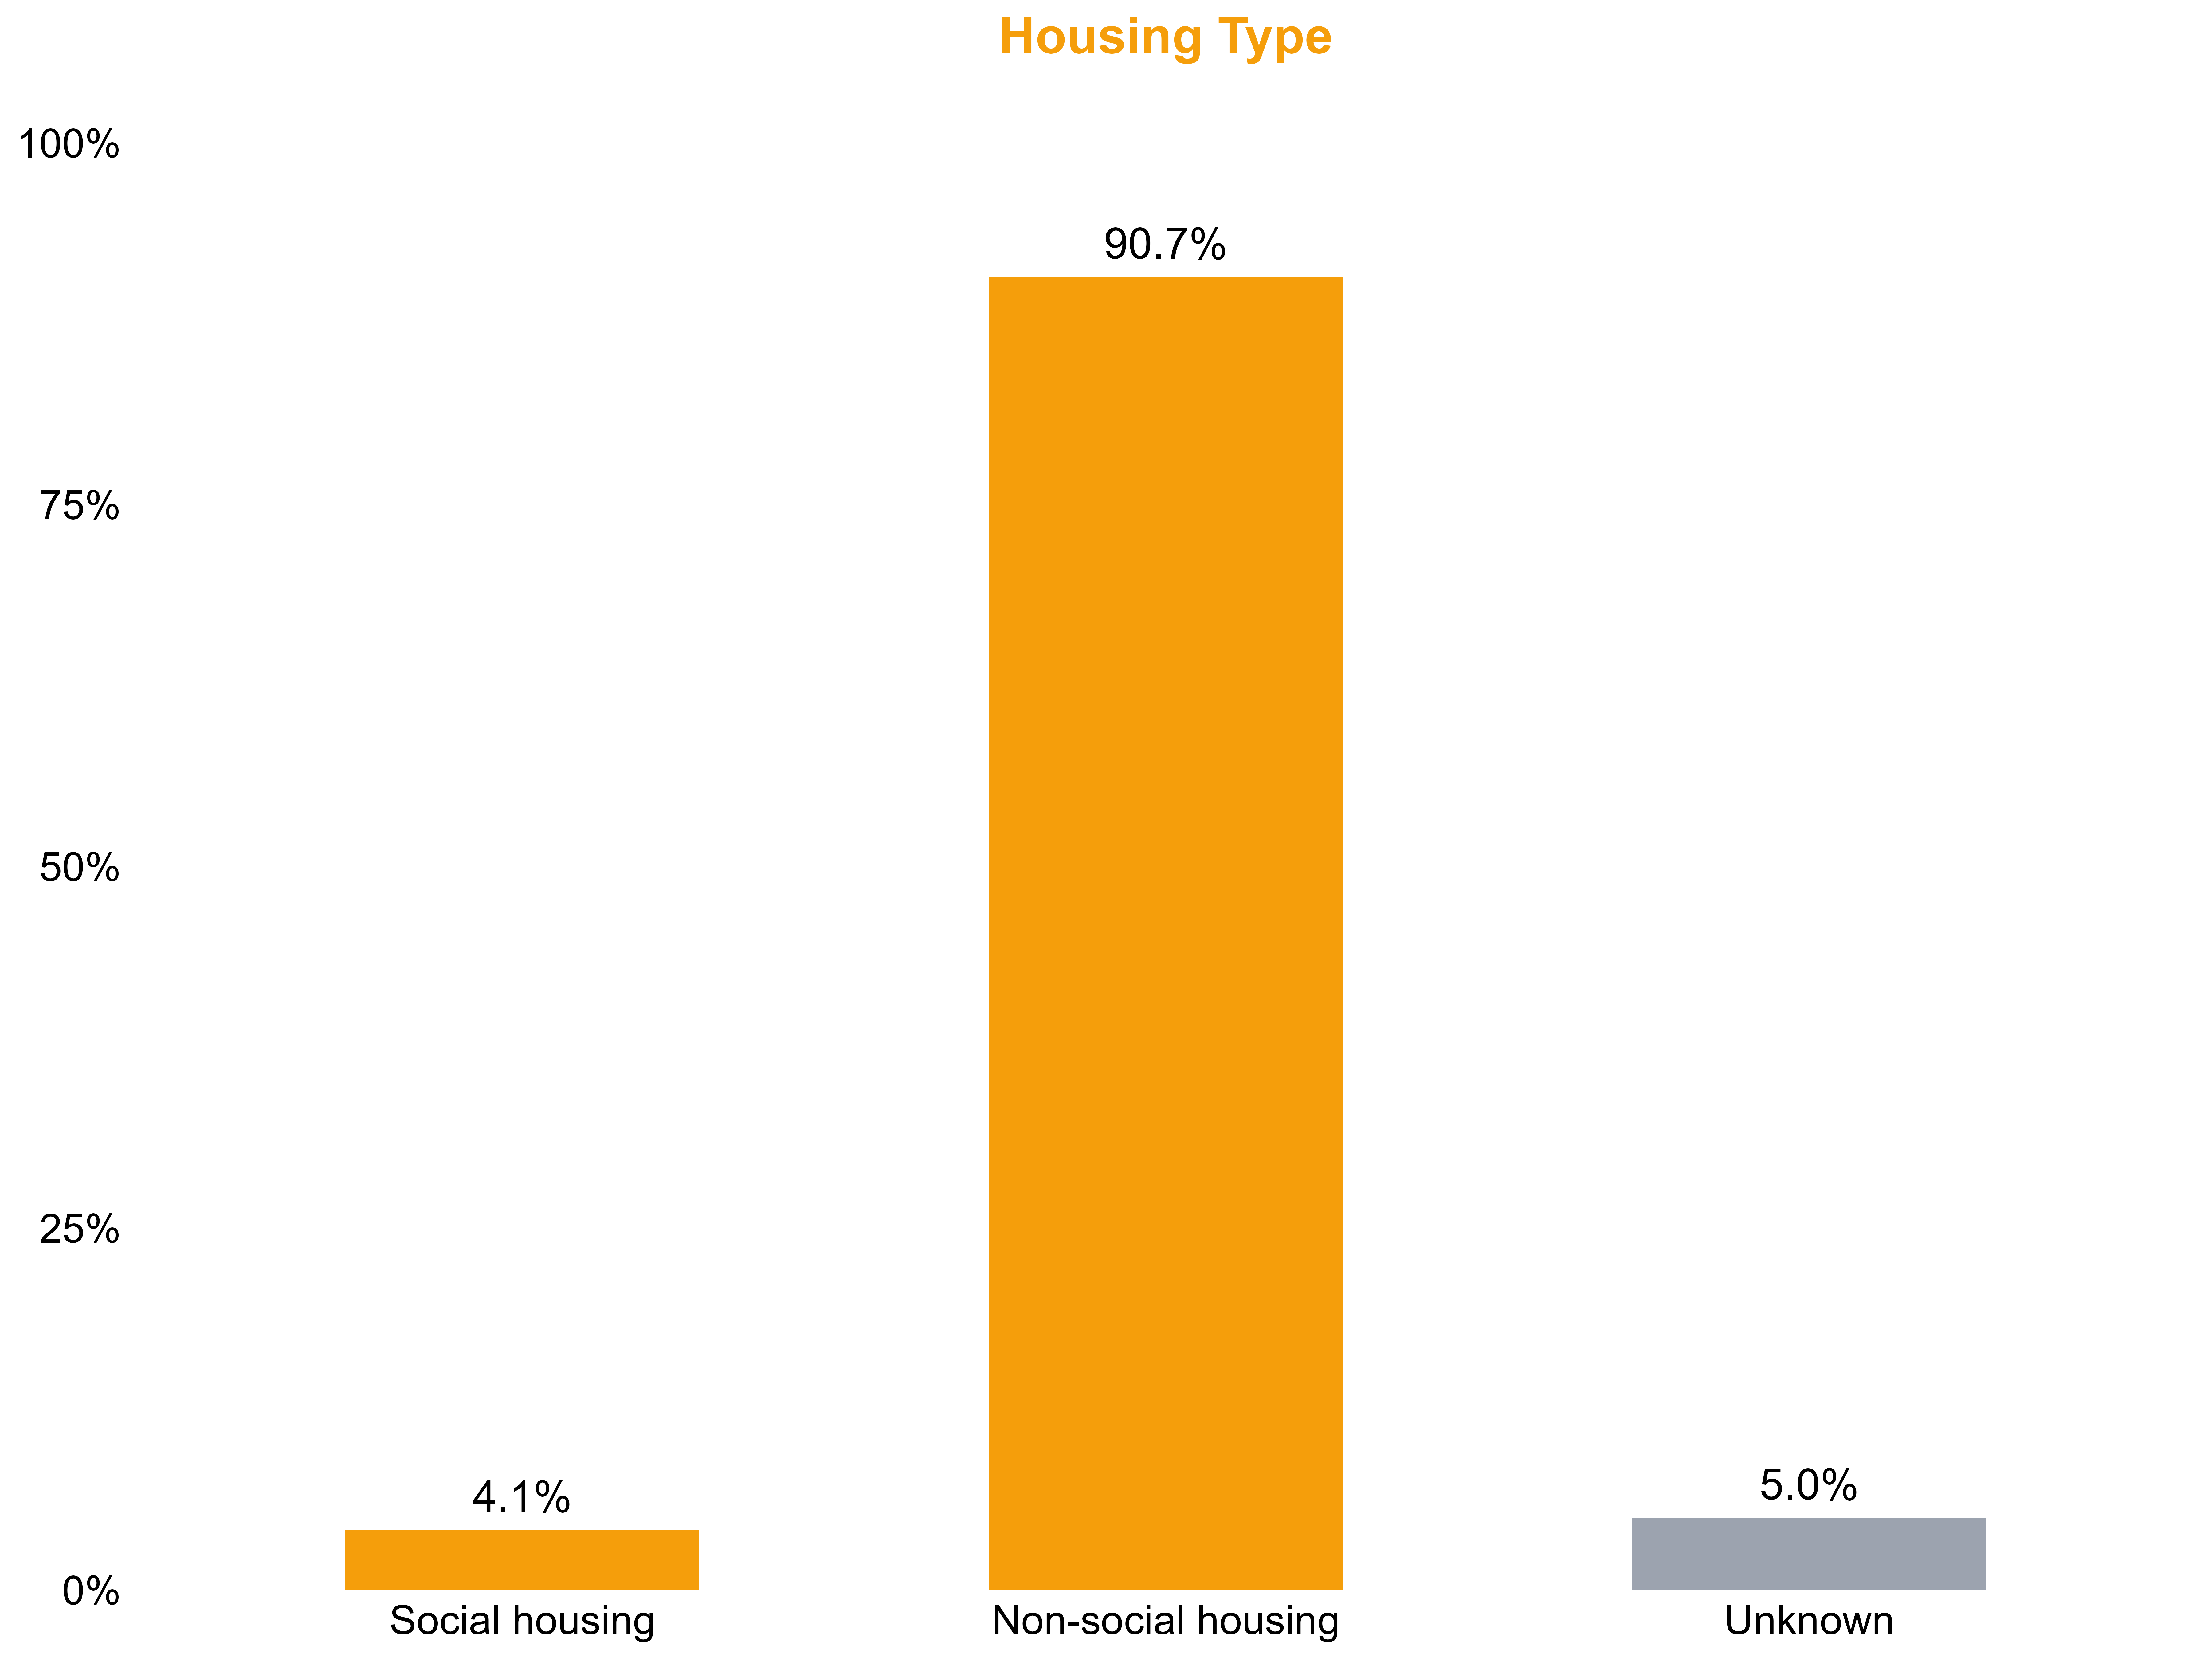
Note: Social housing refers to dwellings provided by the government or community to people in need.
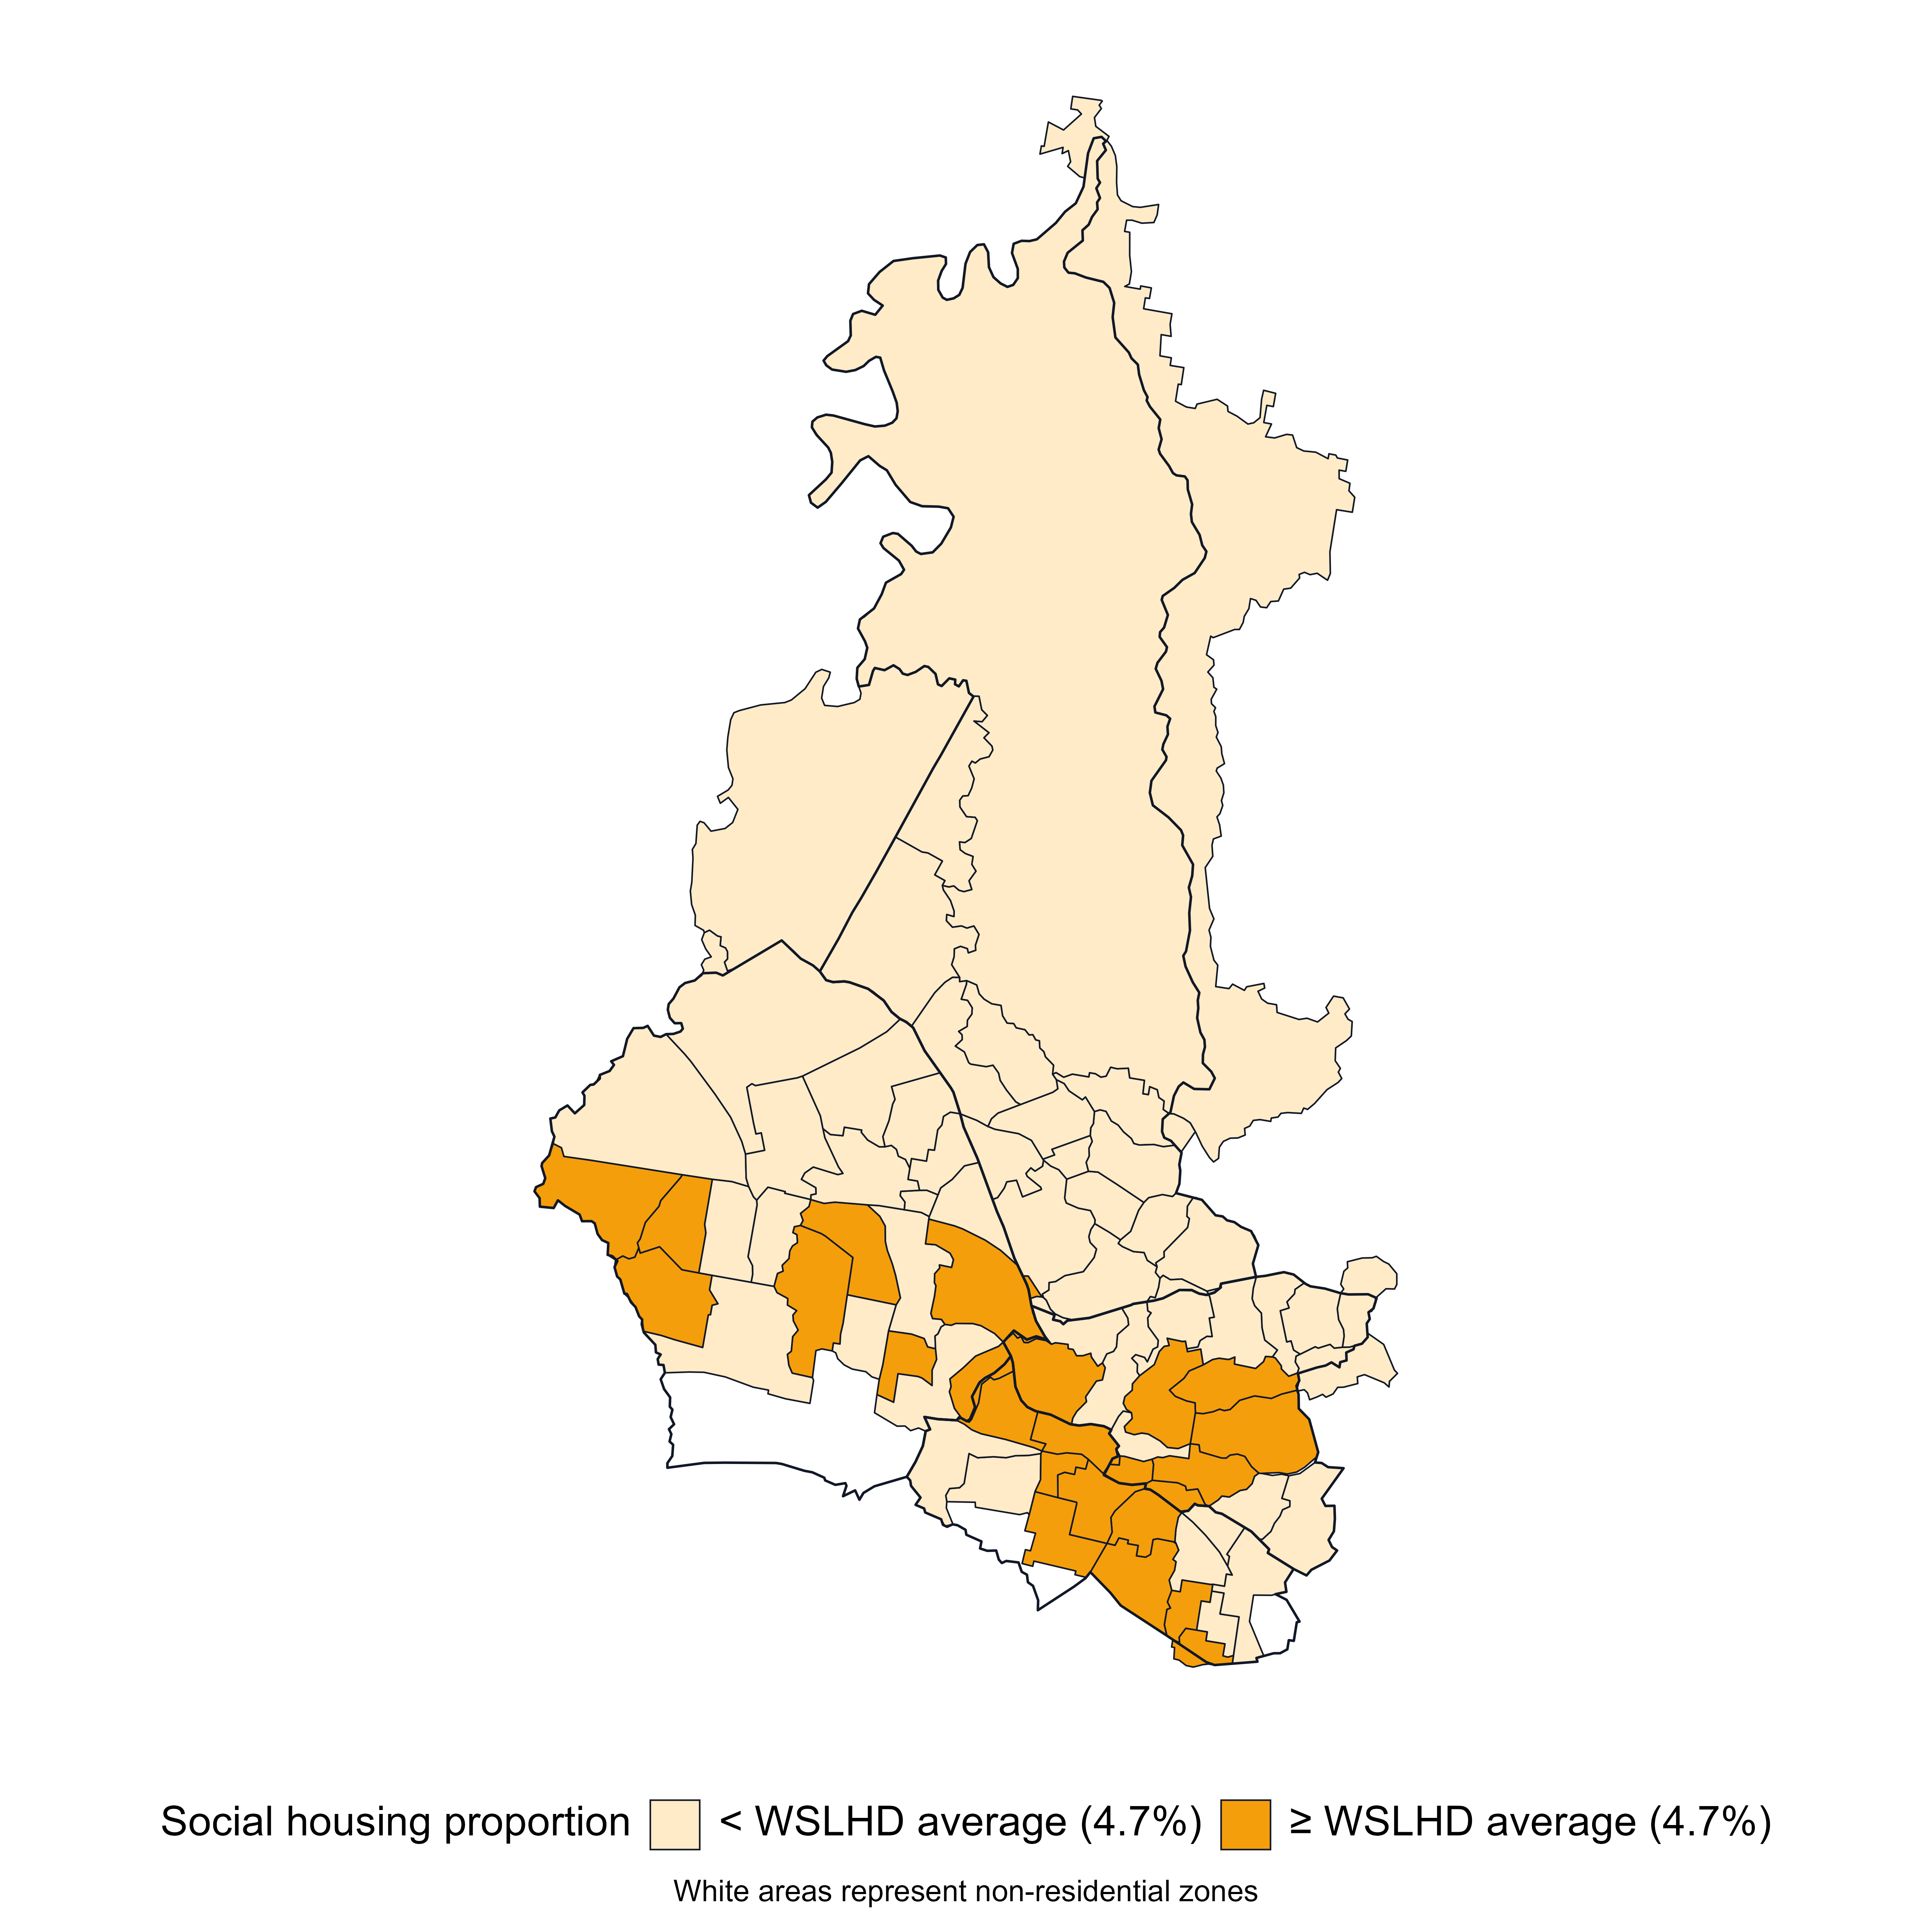
Spatially, social housing was concentrated in southern WSLHD, where proportions exceed the WSLHD average of 4.7%.
Socioeconomic conditions are closely related to health outcomes.
Next, we turn to see how socioeconomic conditions and health outcomes interact to shape life in WSLHD.
Let’s look at the healthcare network in WSLHD.
The acute care facilities within WSLHD include Blacktown Hospital, Mount Druitt Hospital, Westmead Hospital, Auburn Hospital
In addition, Cumberland Hospital serves as a specialised mental health facility.
This is Blacktown Hospital.
This is Mount Druitt Hospital.
These are Westmead Hospital and Cumberland Hospital.
This is Auburn Hospital.
These hospitals, along with their dedicated healthcare workers, stand at the frontline of care, protecting the health of over a million people.
In the 2021 Census, ten selected health conditions were surveyed, including:
- Asthma
- Arthritis
- Mental Health
- Diabetes
- Heart Disease
- Cancer
- Lung Condtions
- kidney Disease
- Dementia
- Stroke
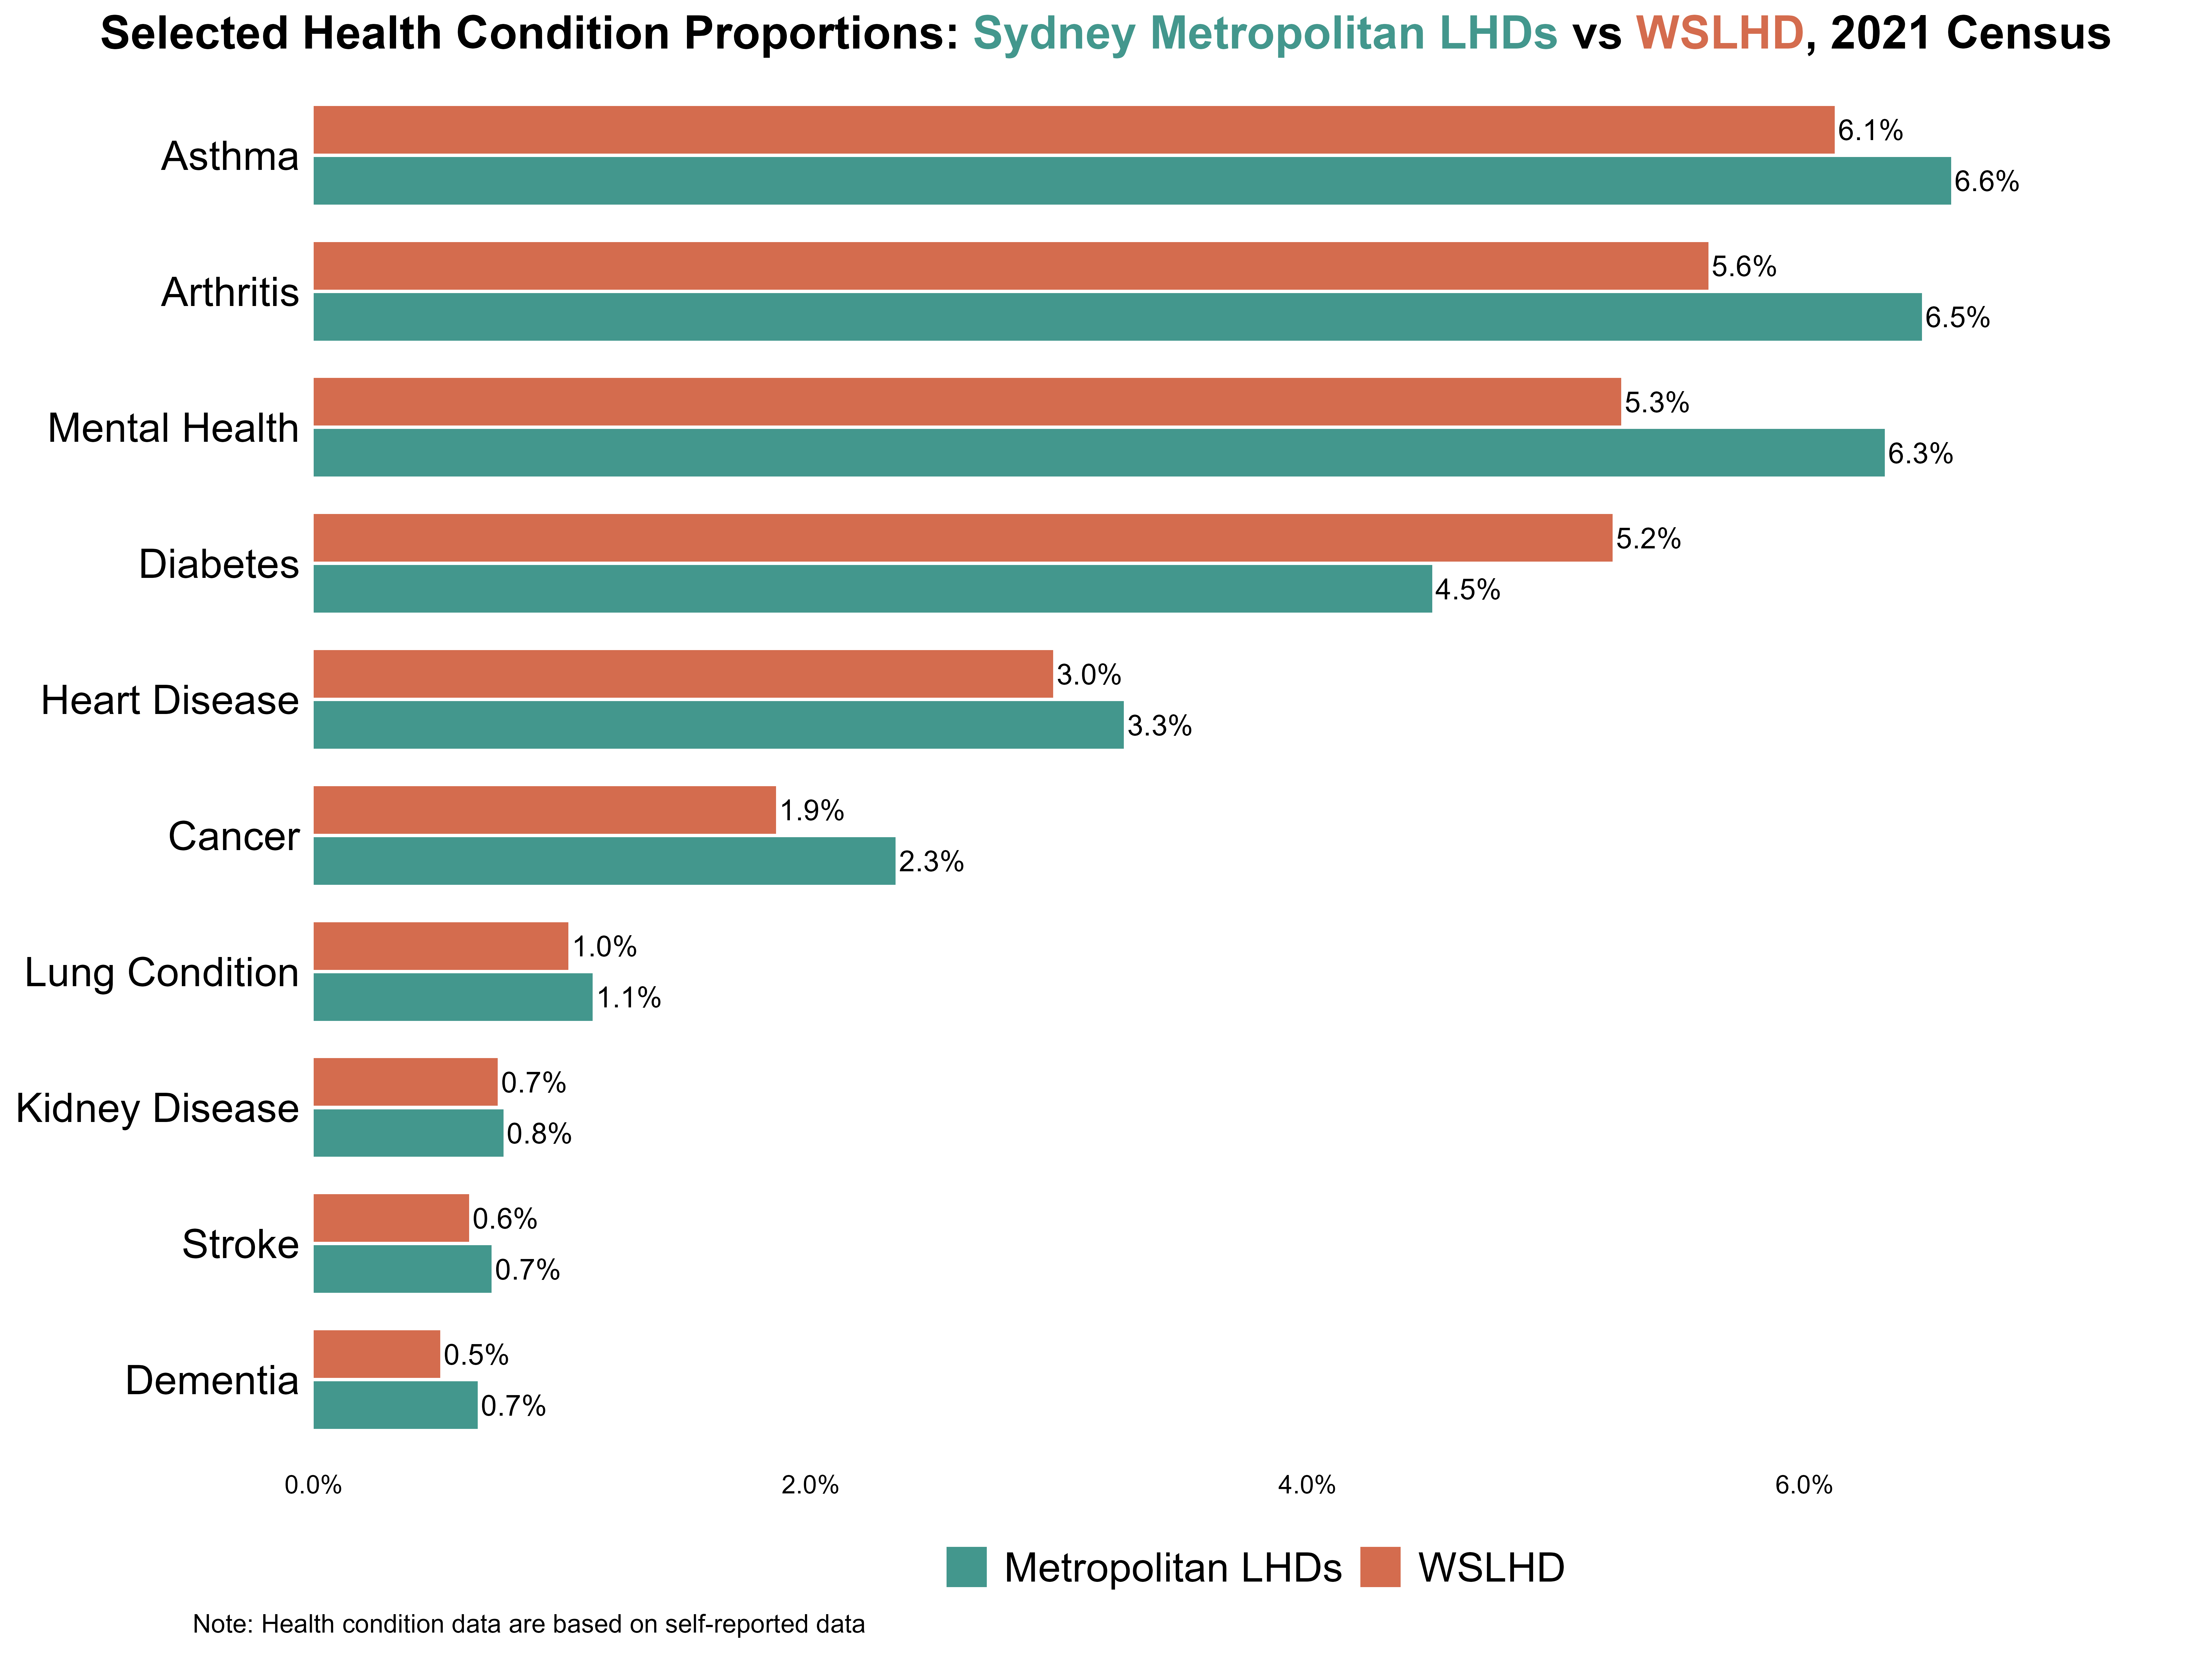
Let’s compare WSLHD with the metropolitan LHD average across these health condition proportions.
We can find that asthma, arthritis, and mental health conditions had the highest prevalence among metropolitan LHDs, each exceeding 6%.
The health burden in WSLHD is also concerning, with these three conditions exceeding 5%.
However, the prevalence of diabetes in WSLHD (5.2%) is notably higher than the metropolitan (4.5%).
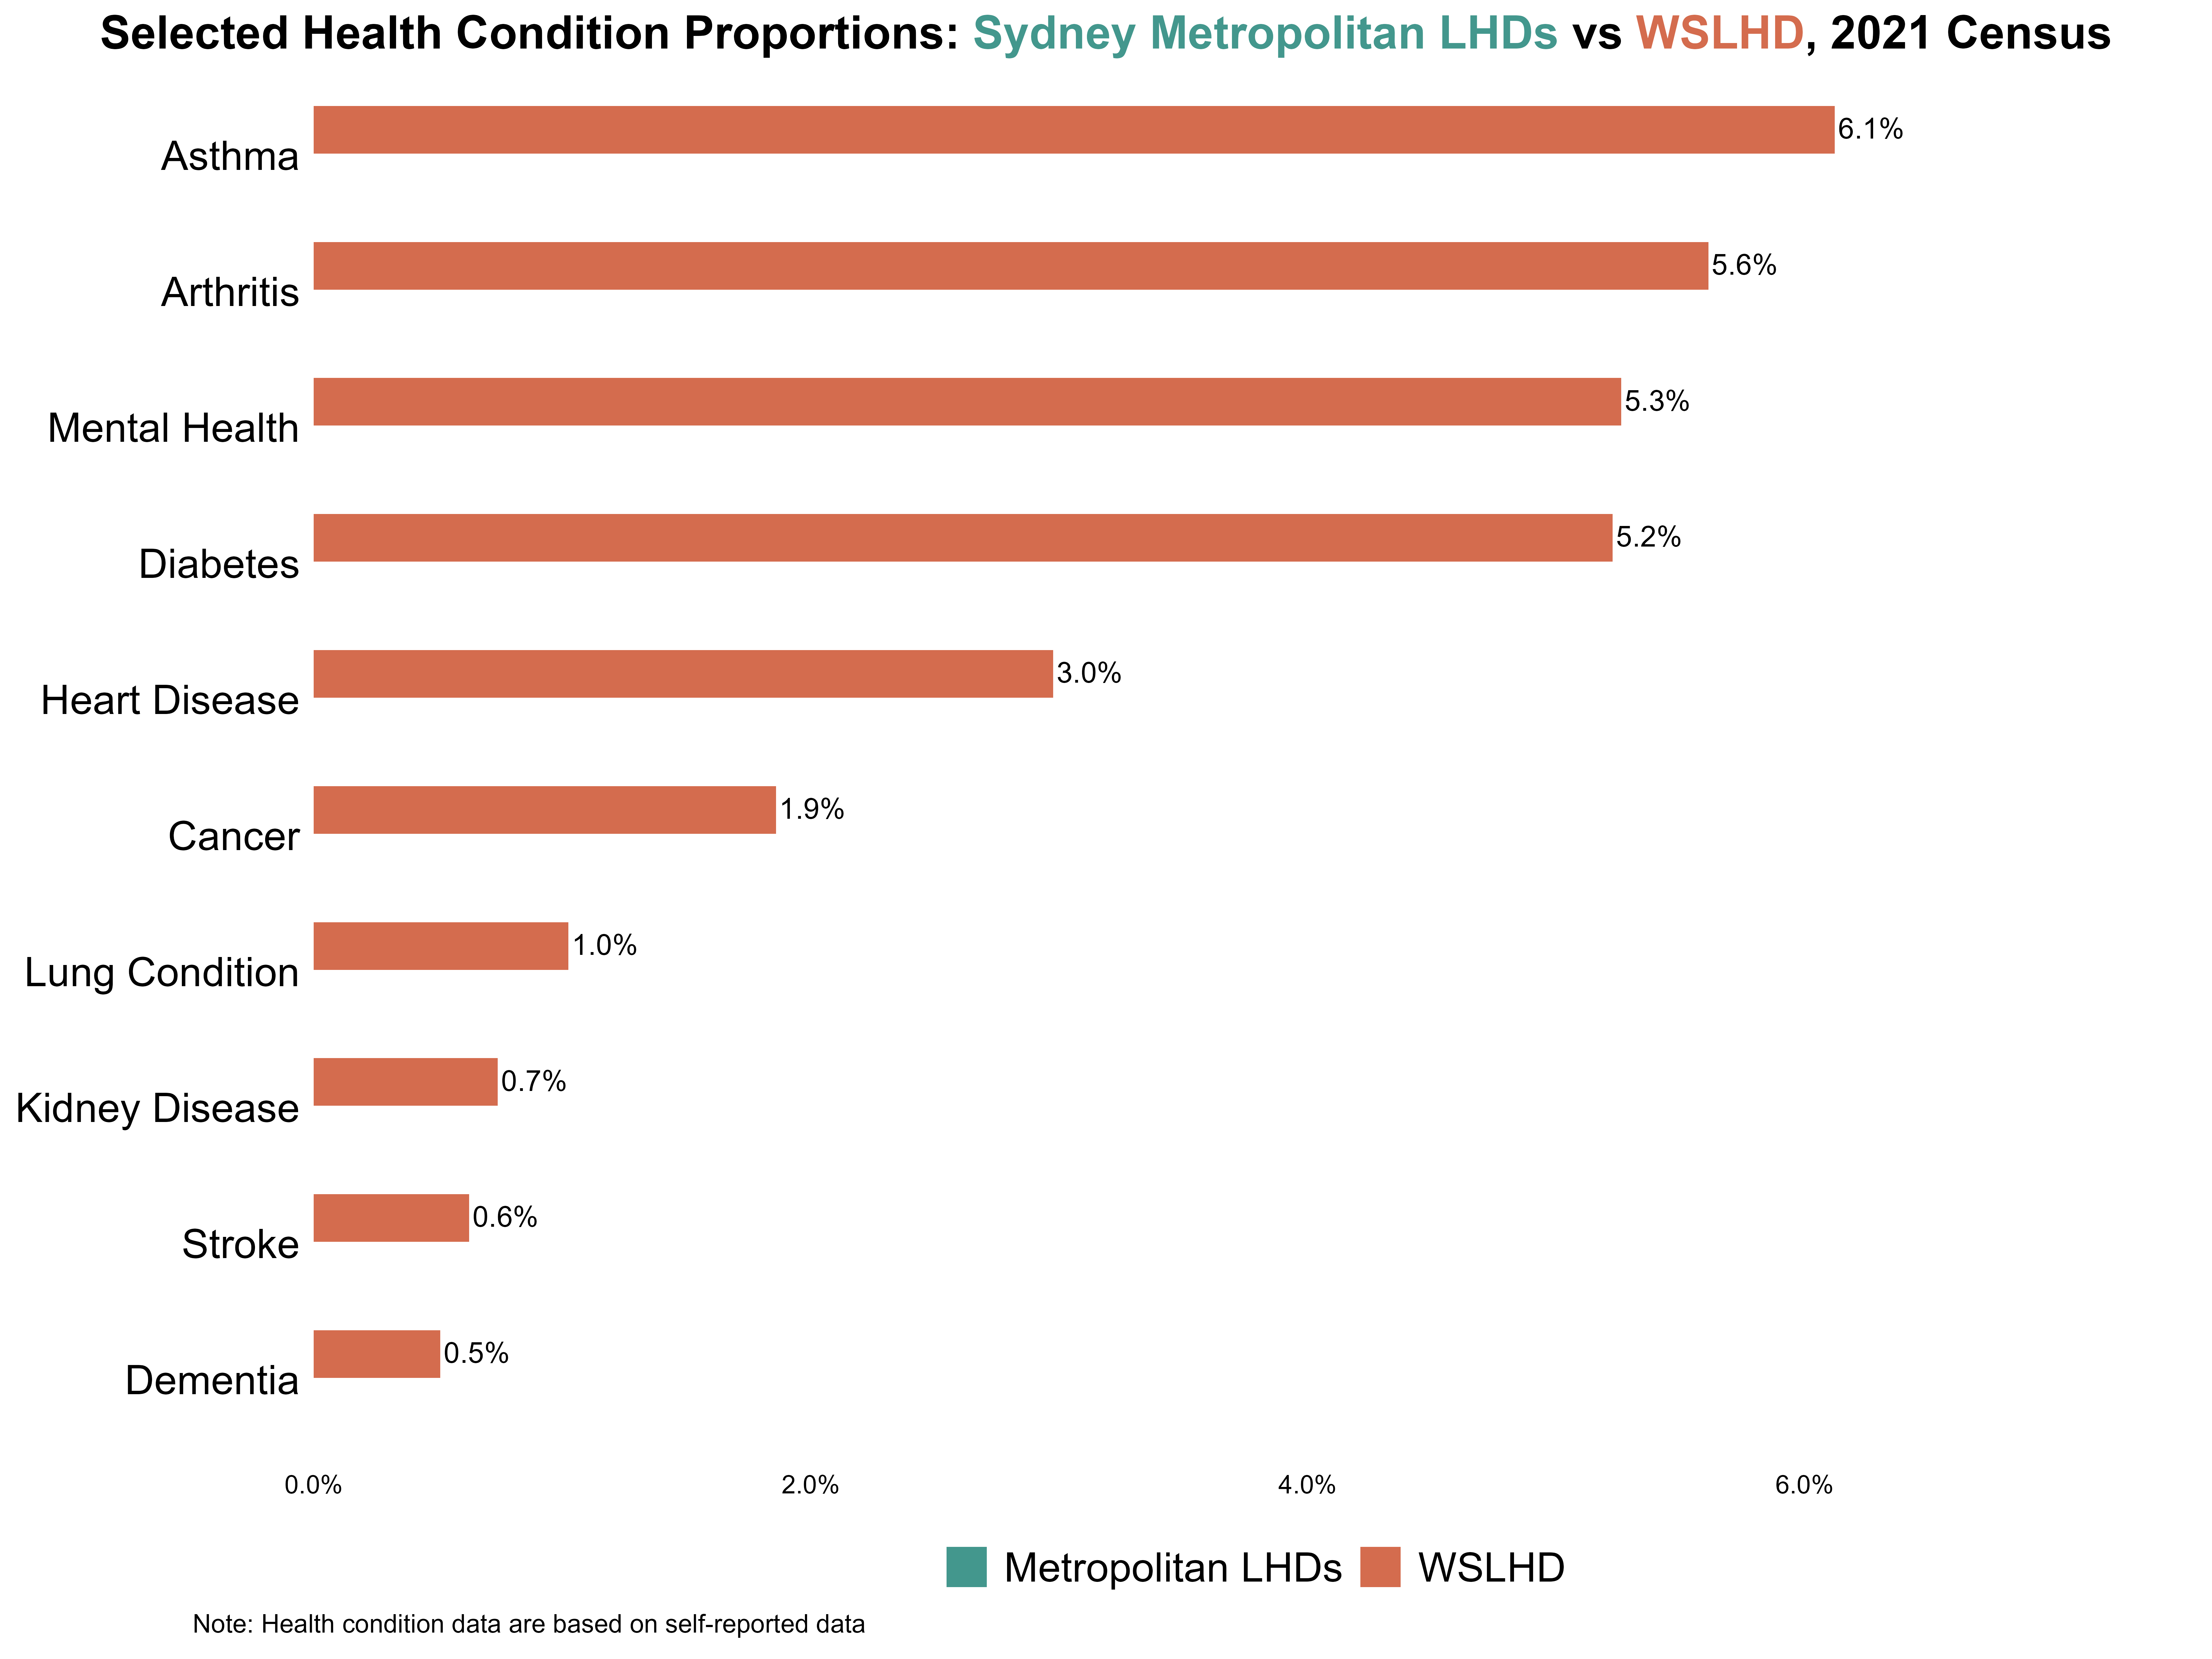
When we focus on WSLHD, we can find that:
Asthma, arthritis, mental health, and diabetes stand out with the highest prevalence, each showing a similar level of around 5–6% and exceeding the remaining conditions by at least 2%.
They provide a clear representation of WSLHD’s overall health burden.
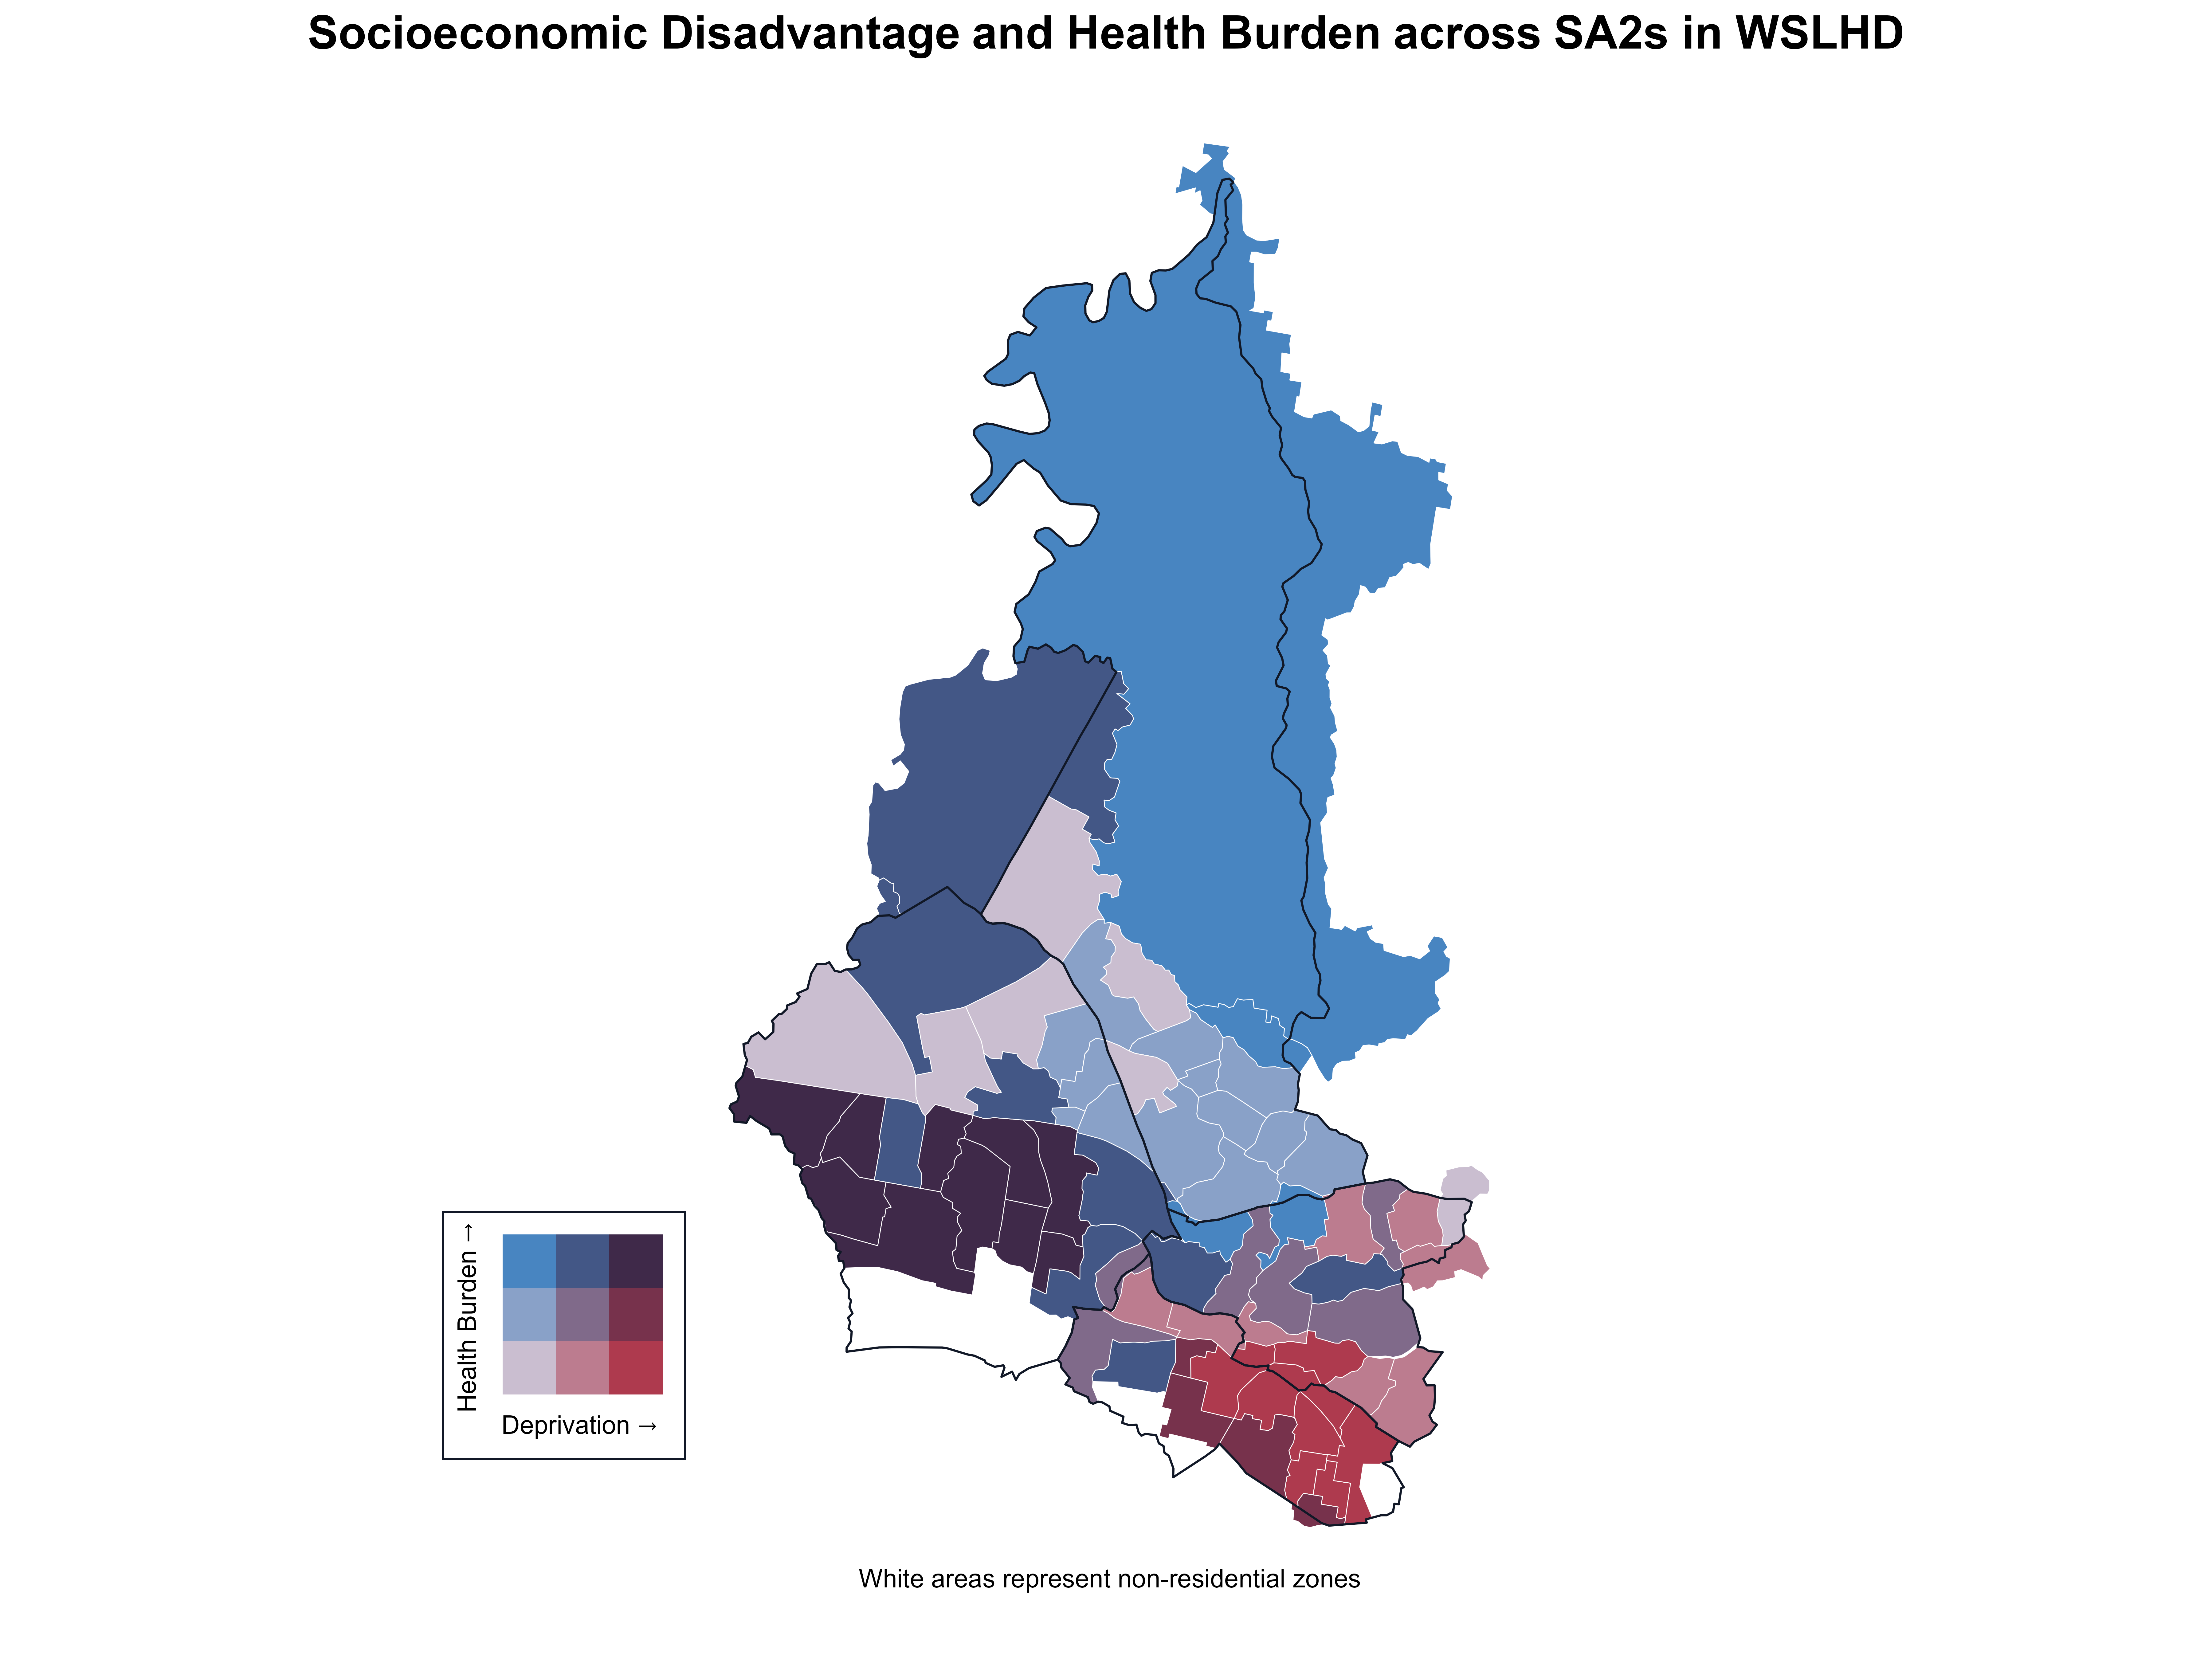
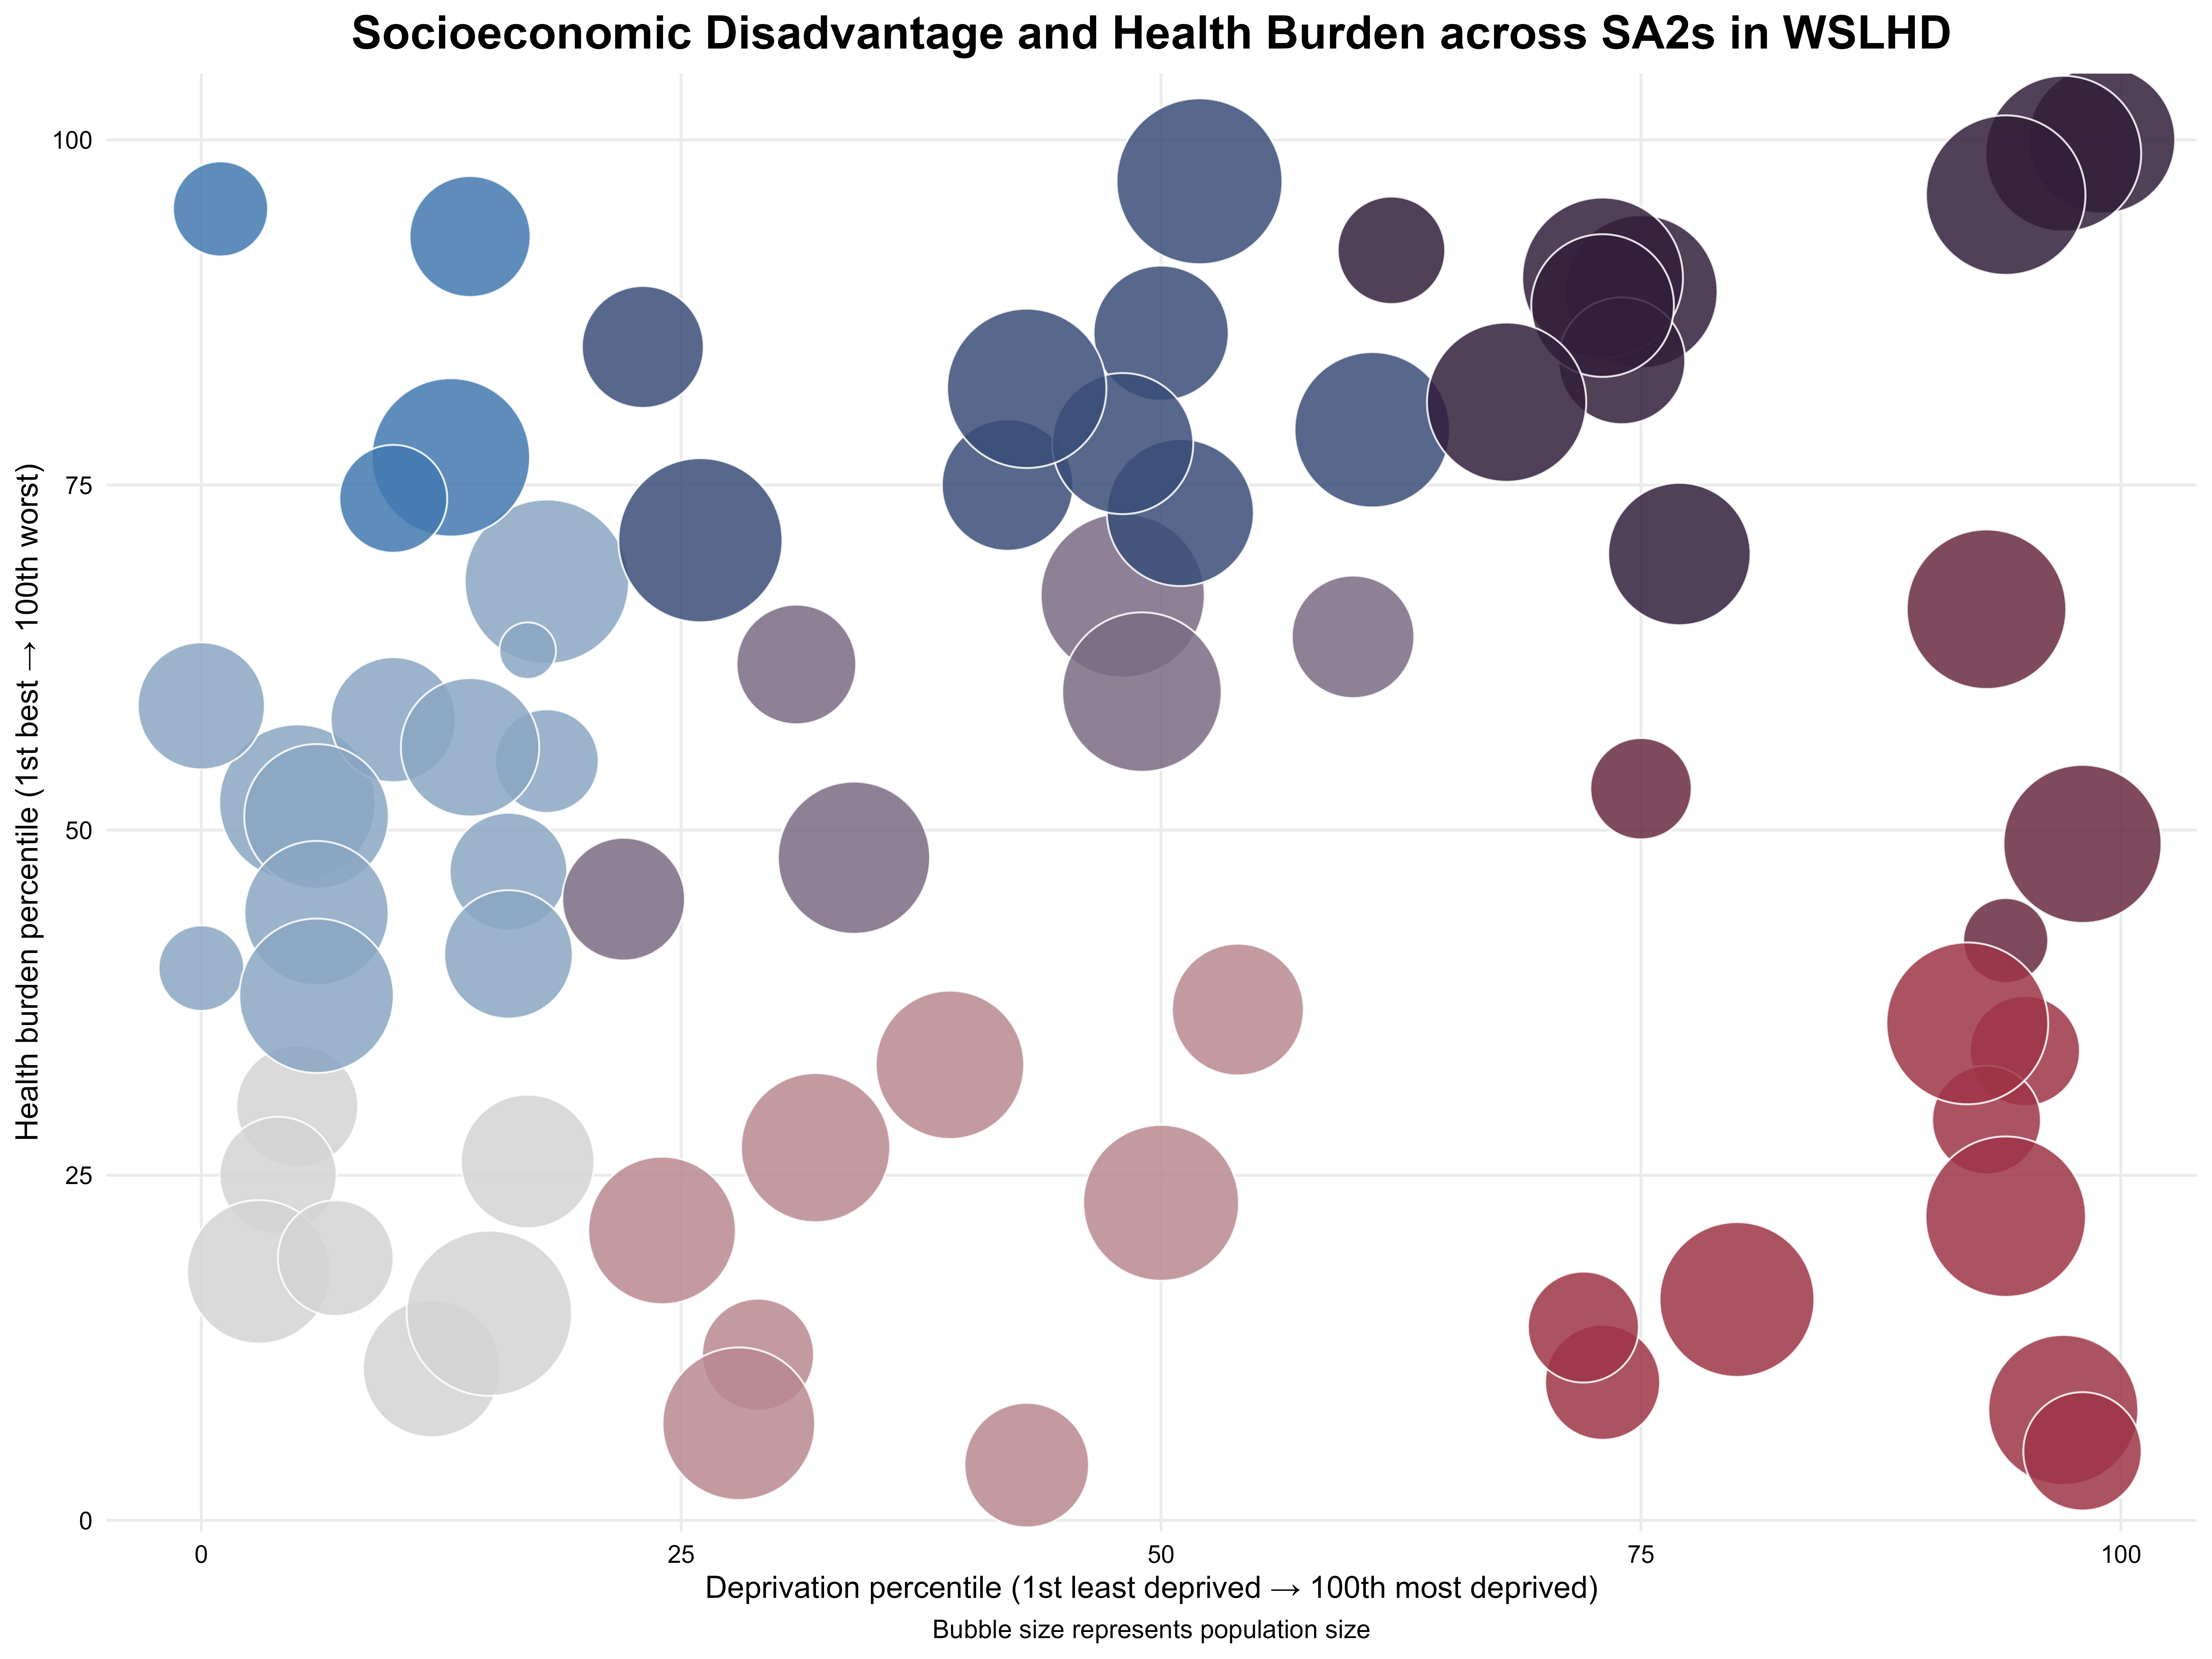
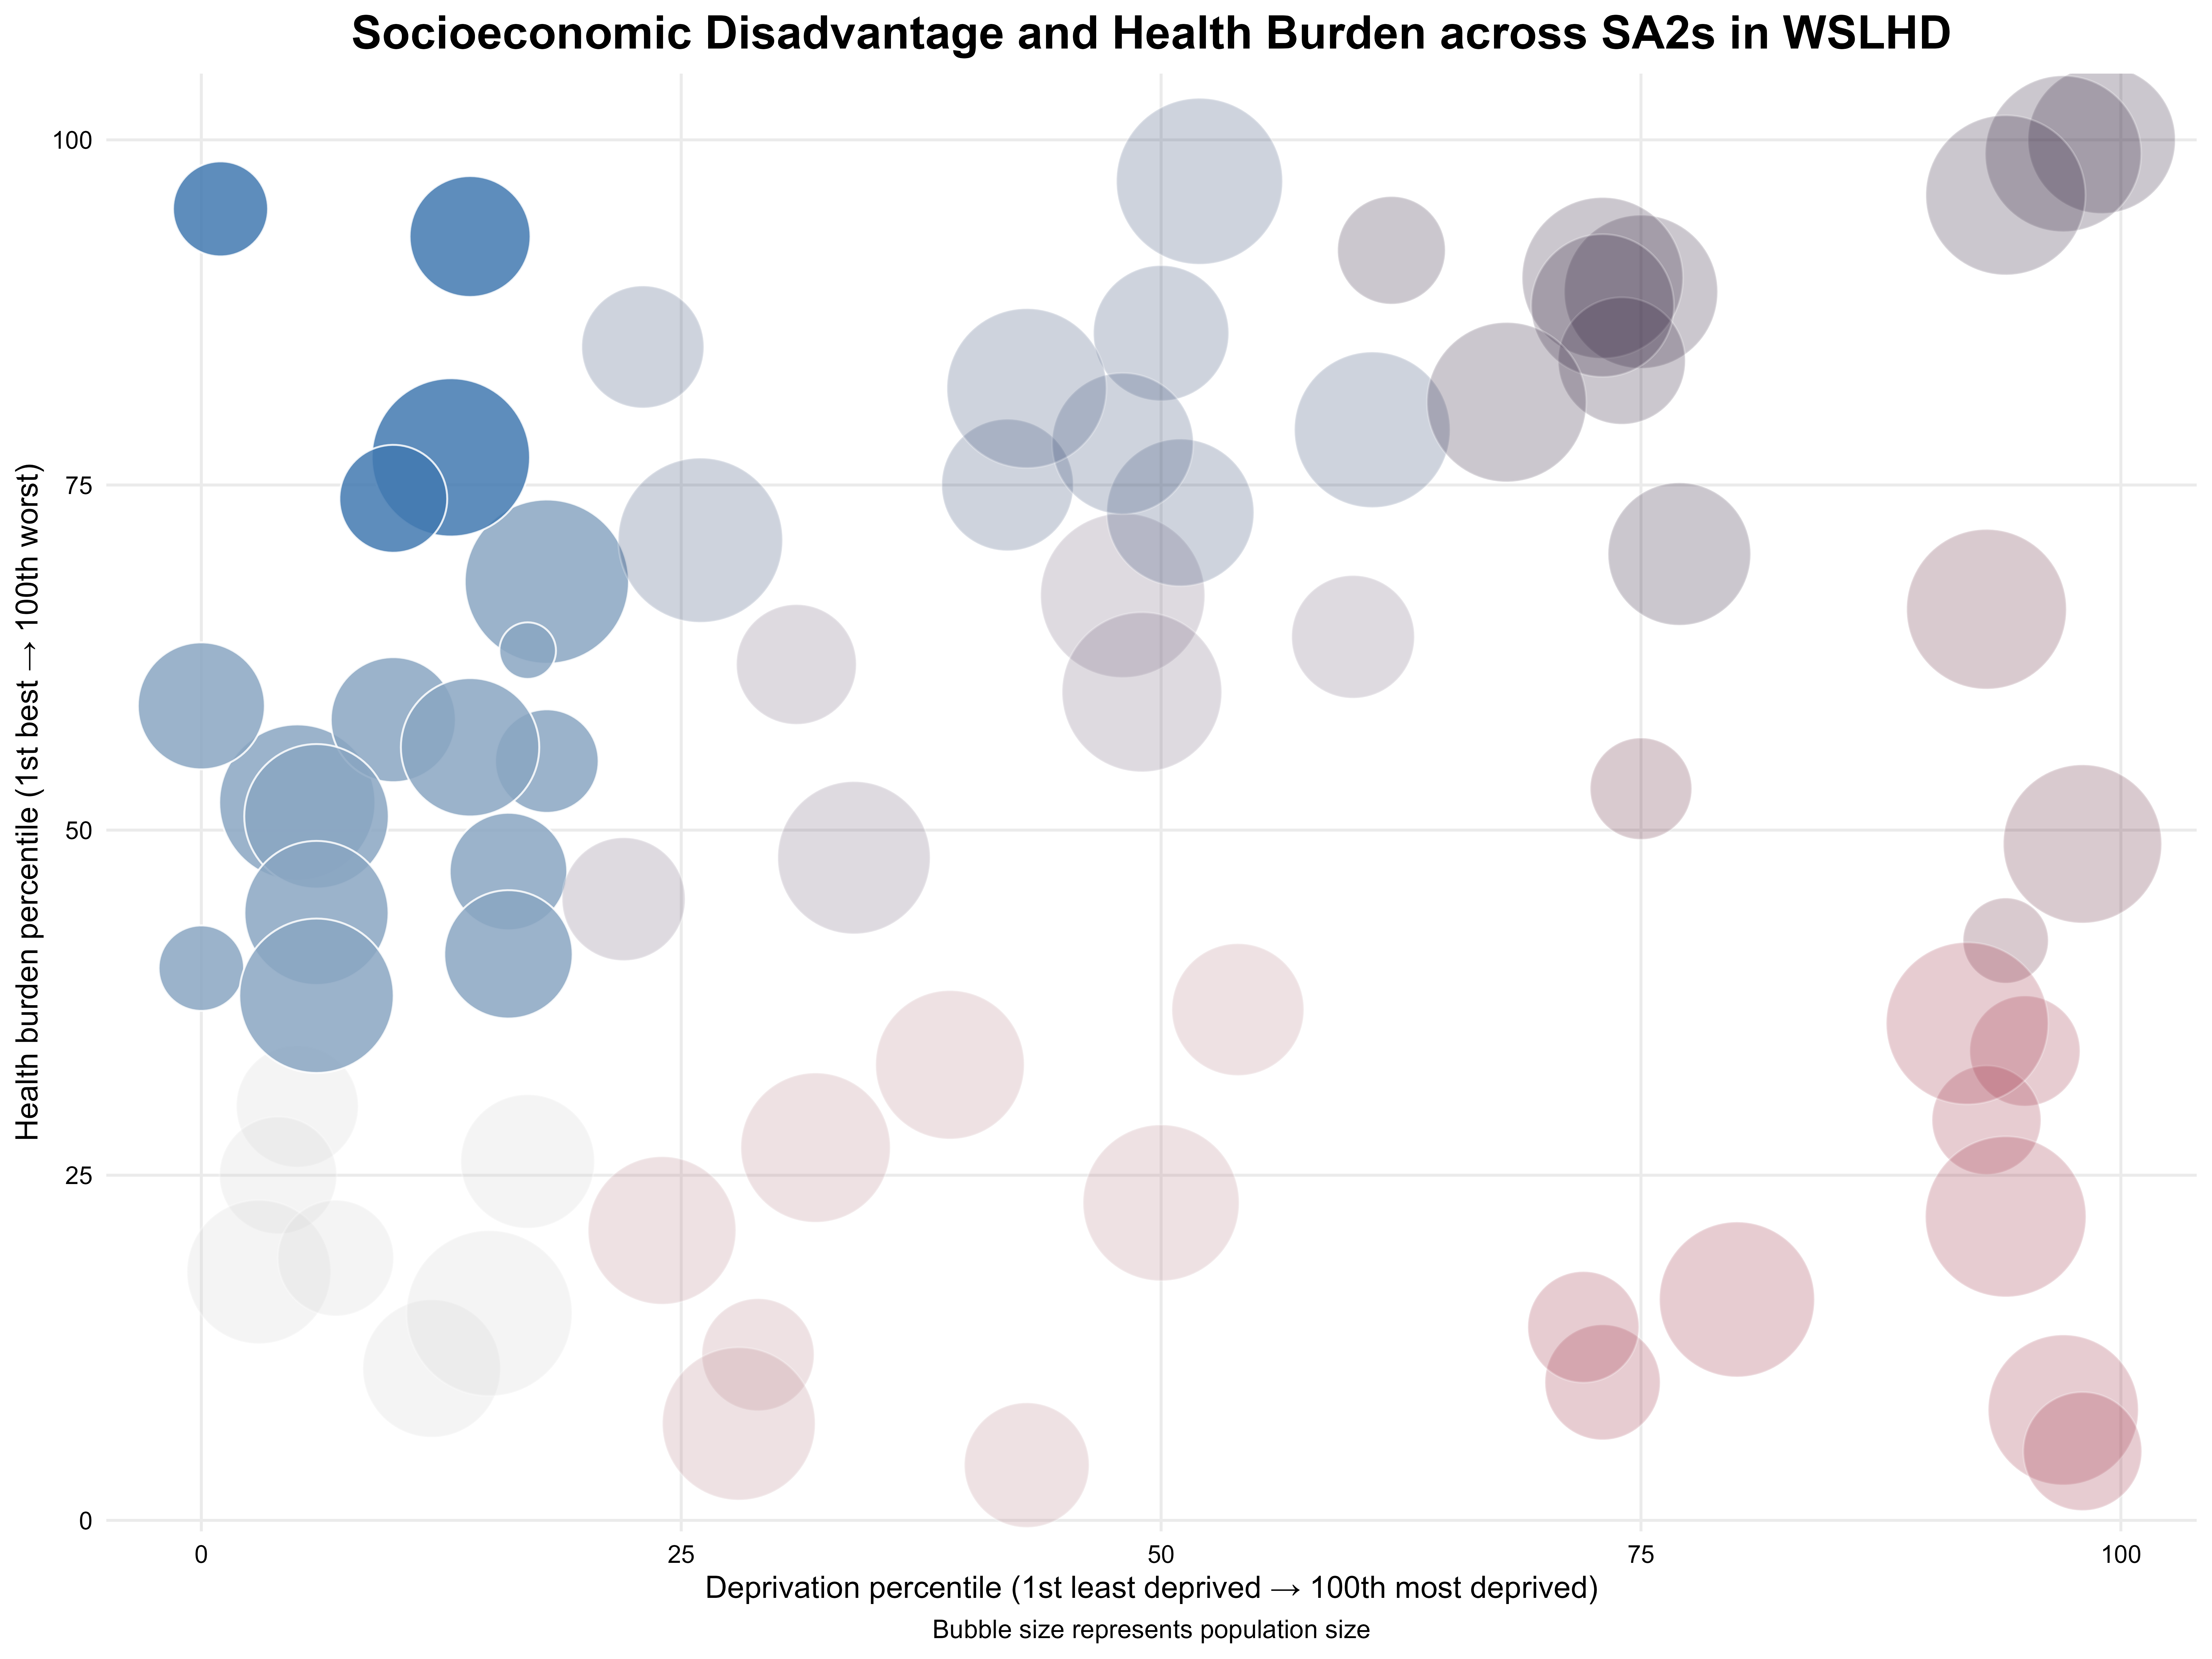
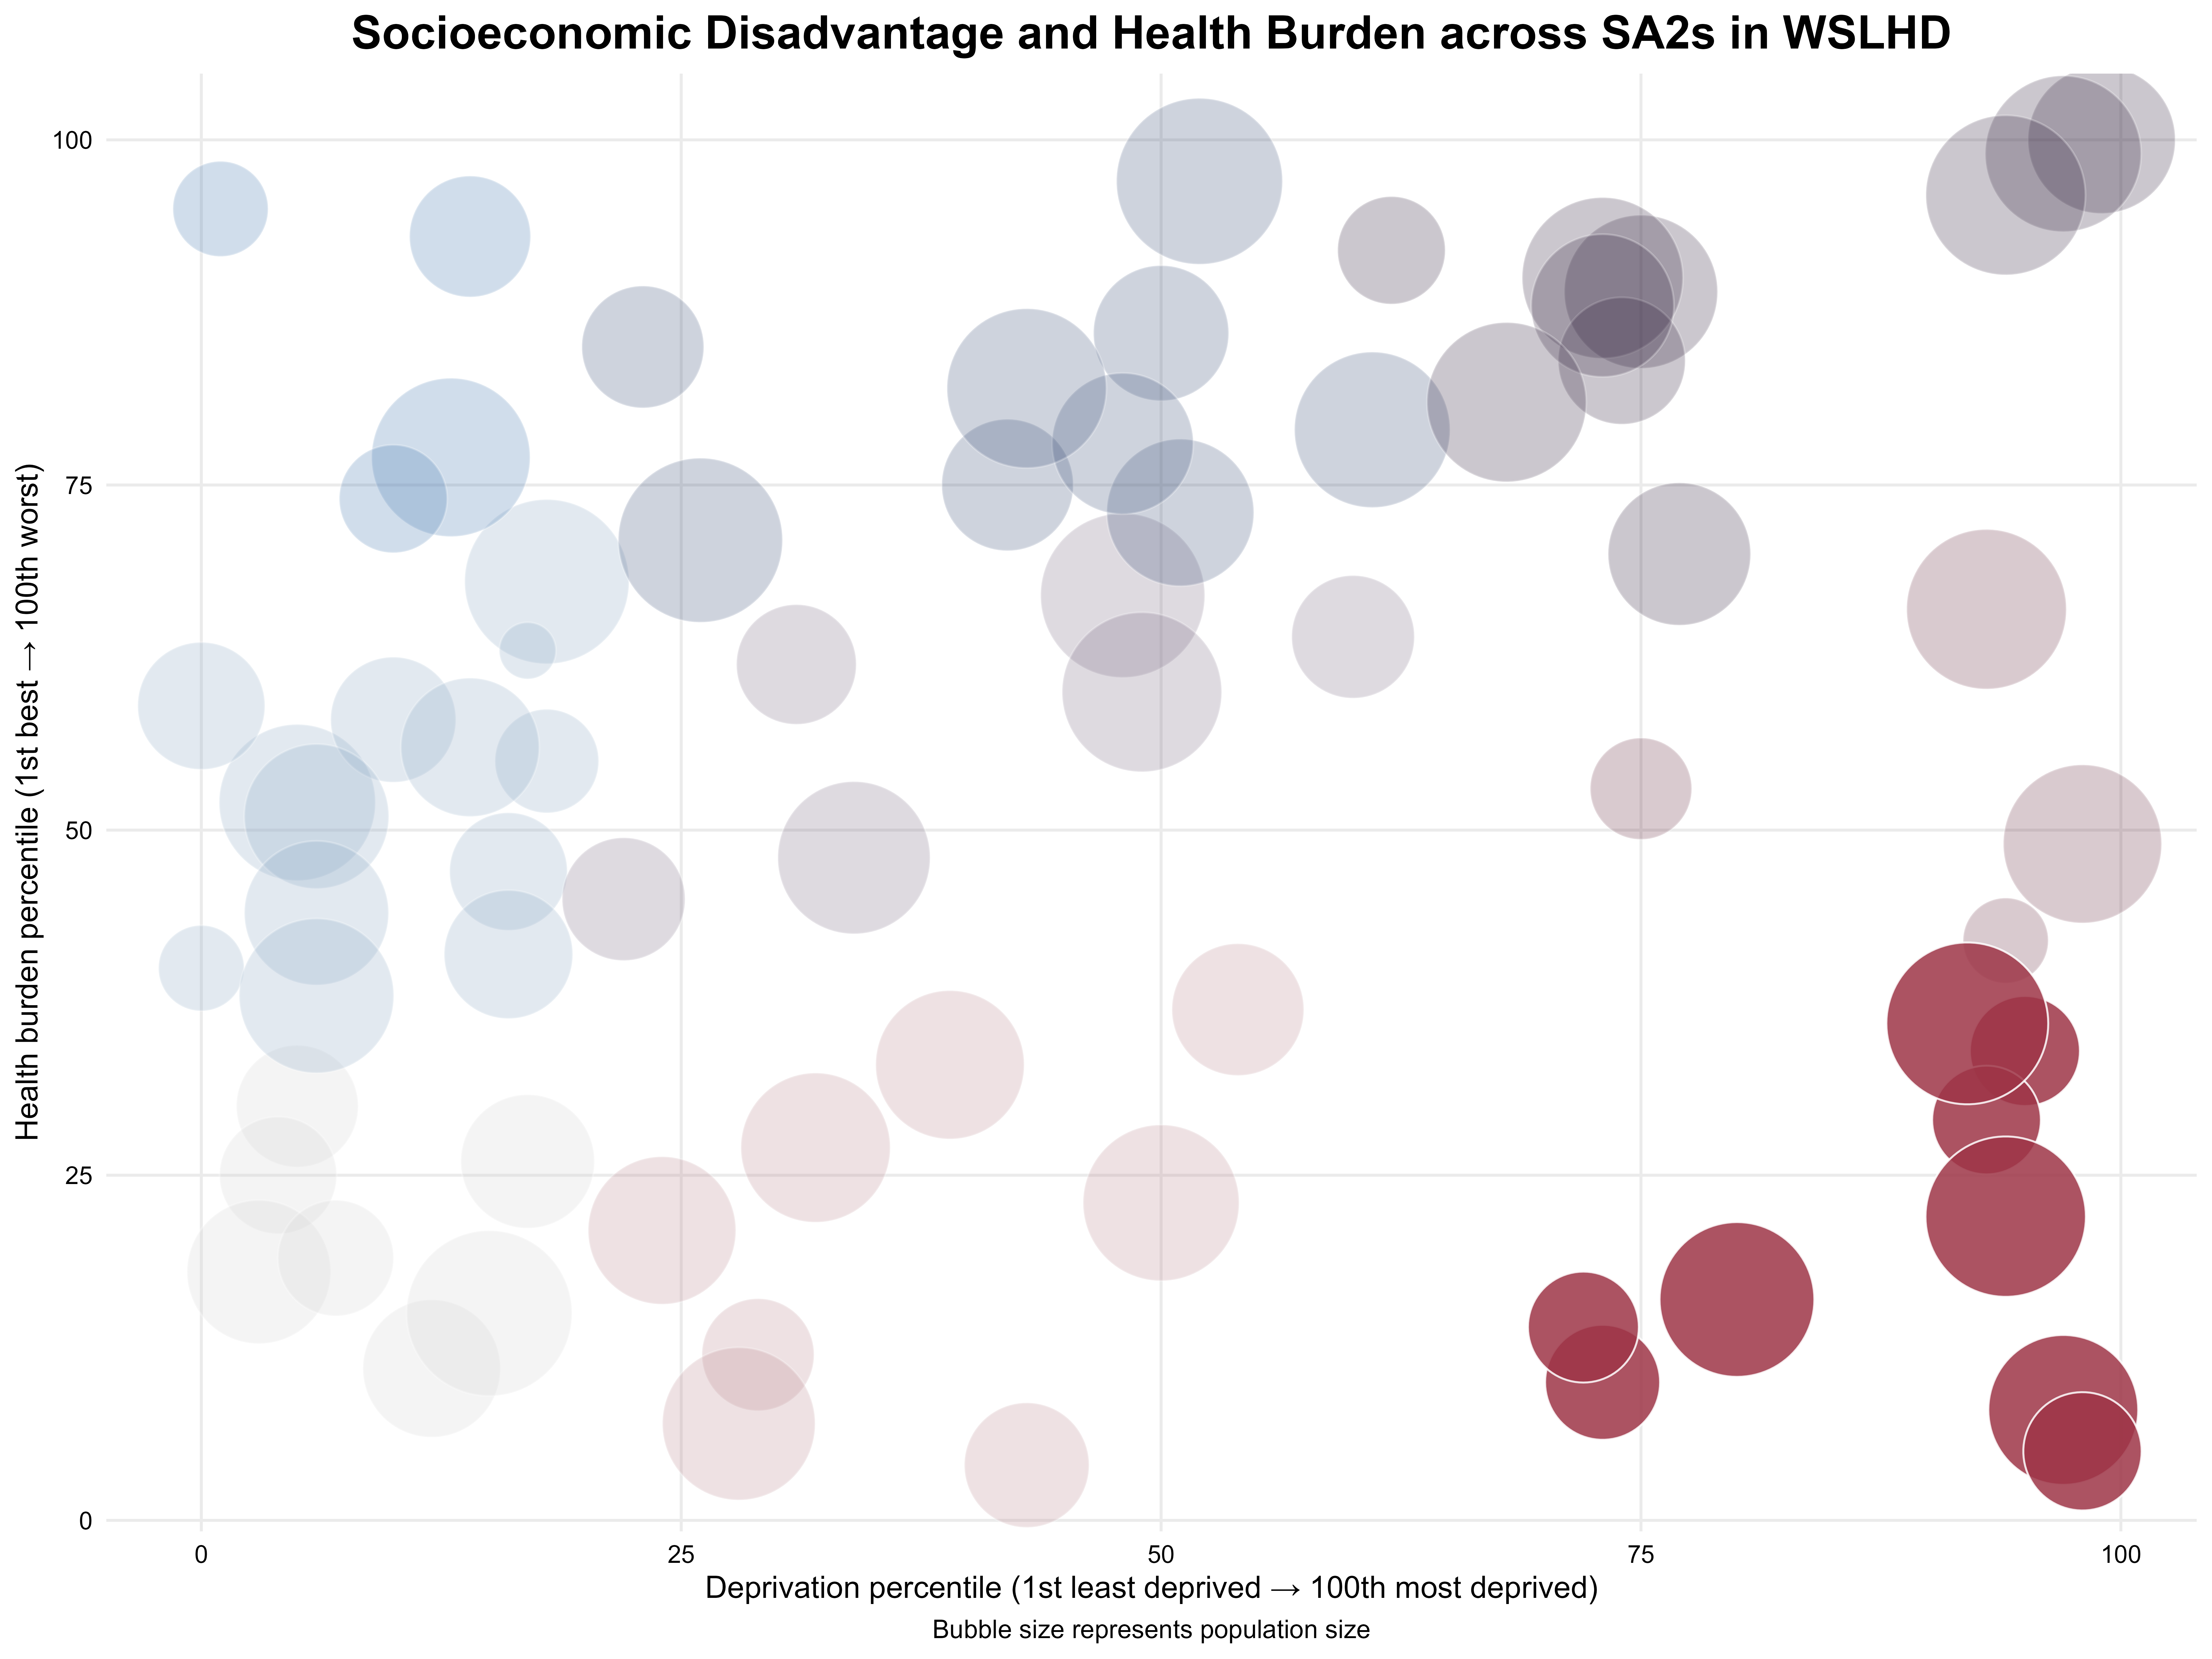
With this foundation, we now examine how socioeconomic disadvantage intersects with these four conditions in WSLHD.
I combined two measures:
- Deprivation Percentile: Computed from Index of Relative Socioeconomic Disadvantage (IRSD) from ABS (check calculation).
- Health-burden Percentile: Computed from the proportions of four key health conditions (check calculation).
Using these two measures, I created the map shown here, which highlights how these patterns vary across SA2s in 2021.
The distribution reveals clear geographic patterns.
SA2s with low deprivation and low health burden clustered along the Blacktown–The Hills Shire border
Southern Blacktown contained the highest concentrations of both deprivation and health burden.
When we shift from the map view to a relationship view, we can find that the relationship between deprivation and health burden is not perfectly linear.
Some SA2s with low deprivation still experienced moderate to high health burden.
Some highly deprived SA2s demonstrated relatively low health burden.
These patterns reflect the internal diversity within WSLHD and suggest that local factors beyond socioeconomic disadvantage also influenced health outcomes.
They also tell us WSLHD contains more complex and interesting patterns waiting to be explored.
The key takeaways from Western Sydney’s journey, 2011 and 2021 Census
Population Growth
1.04M
residents in 2021, +29.6% since 2011.
32.6%
of residents were young adults aged 20-39 in 2021.
43.3%
growth of the 60+ population (2011–2021).
Cultural Diversity
~50%
of residents were new immigrants in 2021.
India
were the top 1 overseas country of birth in 2021.
Cumberland and Parramatta
were LGAs with high concentrations of immigrants in 2021.
Socioeconomics
34.3%
of residents (15+) held a bachelor’s degree in 2021.
41.6%
of workers (15+) were managers or professionals in 2021.
45.5%
of workers (15+) earned less than the NSW median in 2021.
Health Profiles
Asthma, Arthritis, Mental Health, Diabetes
were the top four health conditions with the highest prevalence in 2021.
Southern Blacktown
recorded high health burden and deprivation in 2021.
Blacktown–The Hills Shire Border
recorded low health burden and deprivation in 2021.
Looking ahead, WSLHD’s population is projected to grow by nearly 30% over the decade to 2031, whereas healthcare workforce growth has been considerably slower, at less than half the rate of population growth.
WSLHD stands at an important crossroads. Through continued effort and innovation, WSLHD can rise to meet the needs of a rapidly growing and increasingly diverse community, shaping a healthier future as it moves into the next decade.
The estimated populations for 2021 and 2031 are derived from NSW Health.
The 2021 healthcare workforce estimate is sourced from the NSW Health Workforce Data Report (2024).
The 2031 healthcare workforce estimate is a simple linear extrapolation based on 2019–2024 growth trends from the Workforce Data Report. Only for illustration purposes, rather than forecasting.
Thanks for your reading. Further exploration is now in your hands!
Appendix
Data Source
The analysis is based on Census data from 2011 and 2021, accessed through the Australian Bureau of Statistics.
Image Source
The hero images used at the beginning of each section are sourced from Unsplash and Adobe Stock.
Credit
This scrollytelling article was developed by Zahcary Xie and submitted in partial fulfilment of the requirements for the degree of Master of Science in Health Data Science at UNSW.
Acknowledgment
The project was supervised by
Dr Mark Hanly (Centre for Big Data Research in Health, Faculty of Medicine and Health, UNSW Sydney)
Dr Claire Deakin (School of Population Health, Faculty of Medicine and Health, UNSW Sydney and Research and Education Network Western Sydney Local Health District, Sydney)